The scenarios consider how the single most influential driver of the GST distribution, mining revenues, could affect Victoria’s GST share. The analysis is then expanded to include a range of variables and their interactions with each other, given the range of forecasts for iron ore, in turn affecting mining royalty revenues.
4.1 Fiscal impacts of the new system and no-worse-off payments
To test the impacts of the new system on Victoria, we have calculated the difference in GST revenue under the new and former systems, which are represented by no-worse-off payments for the period of the no-worse-off guarantee.
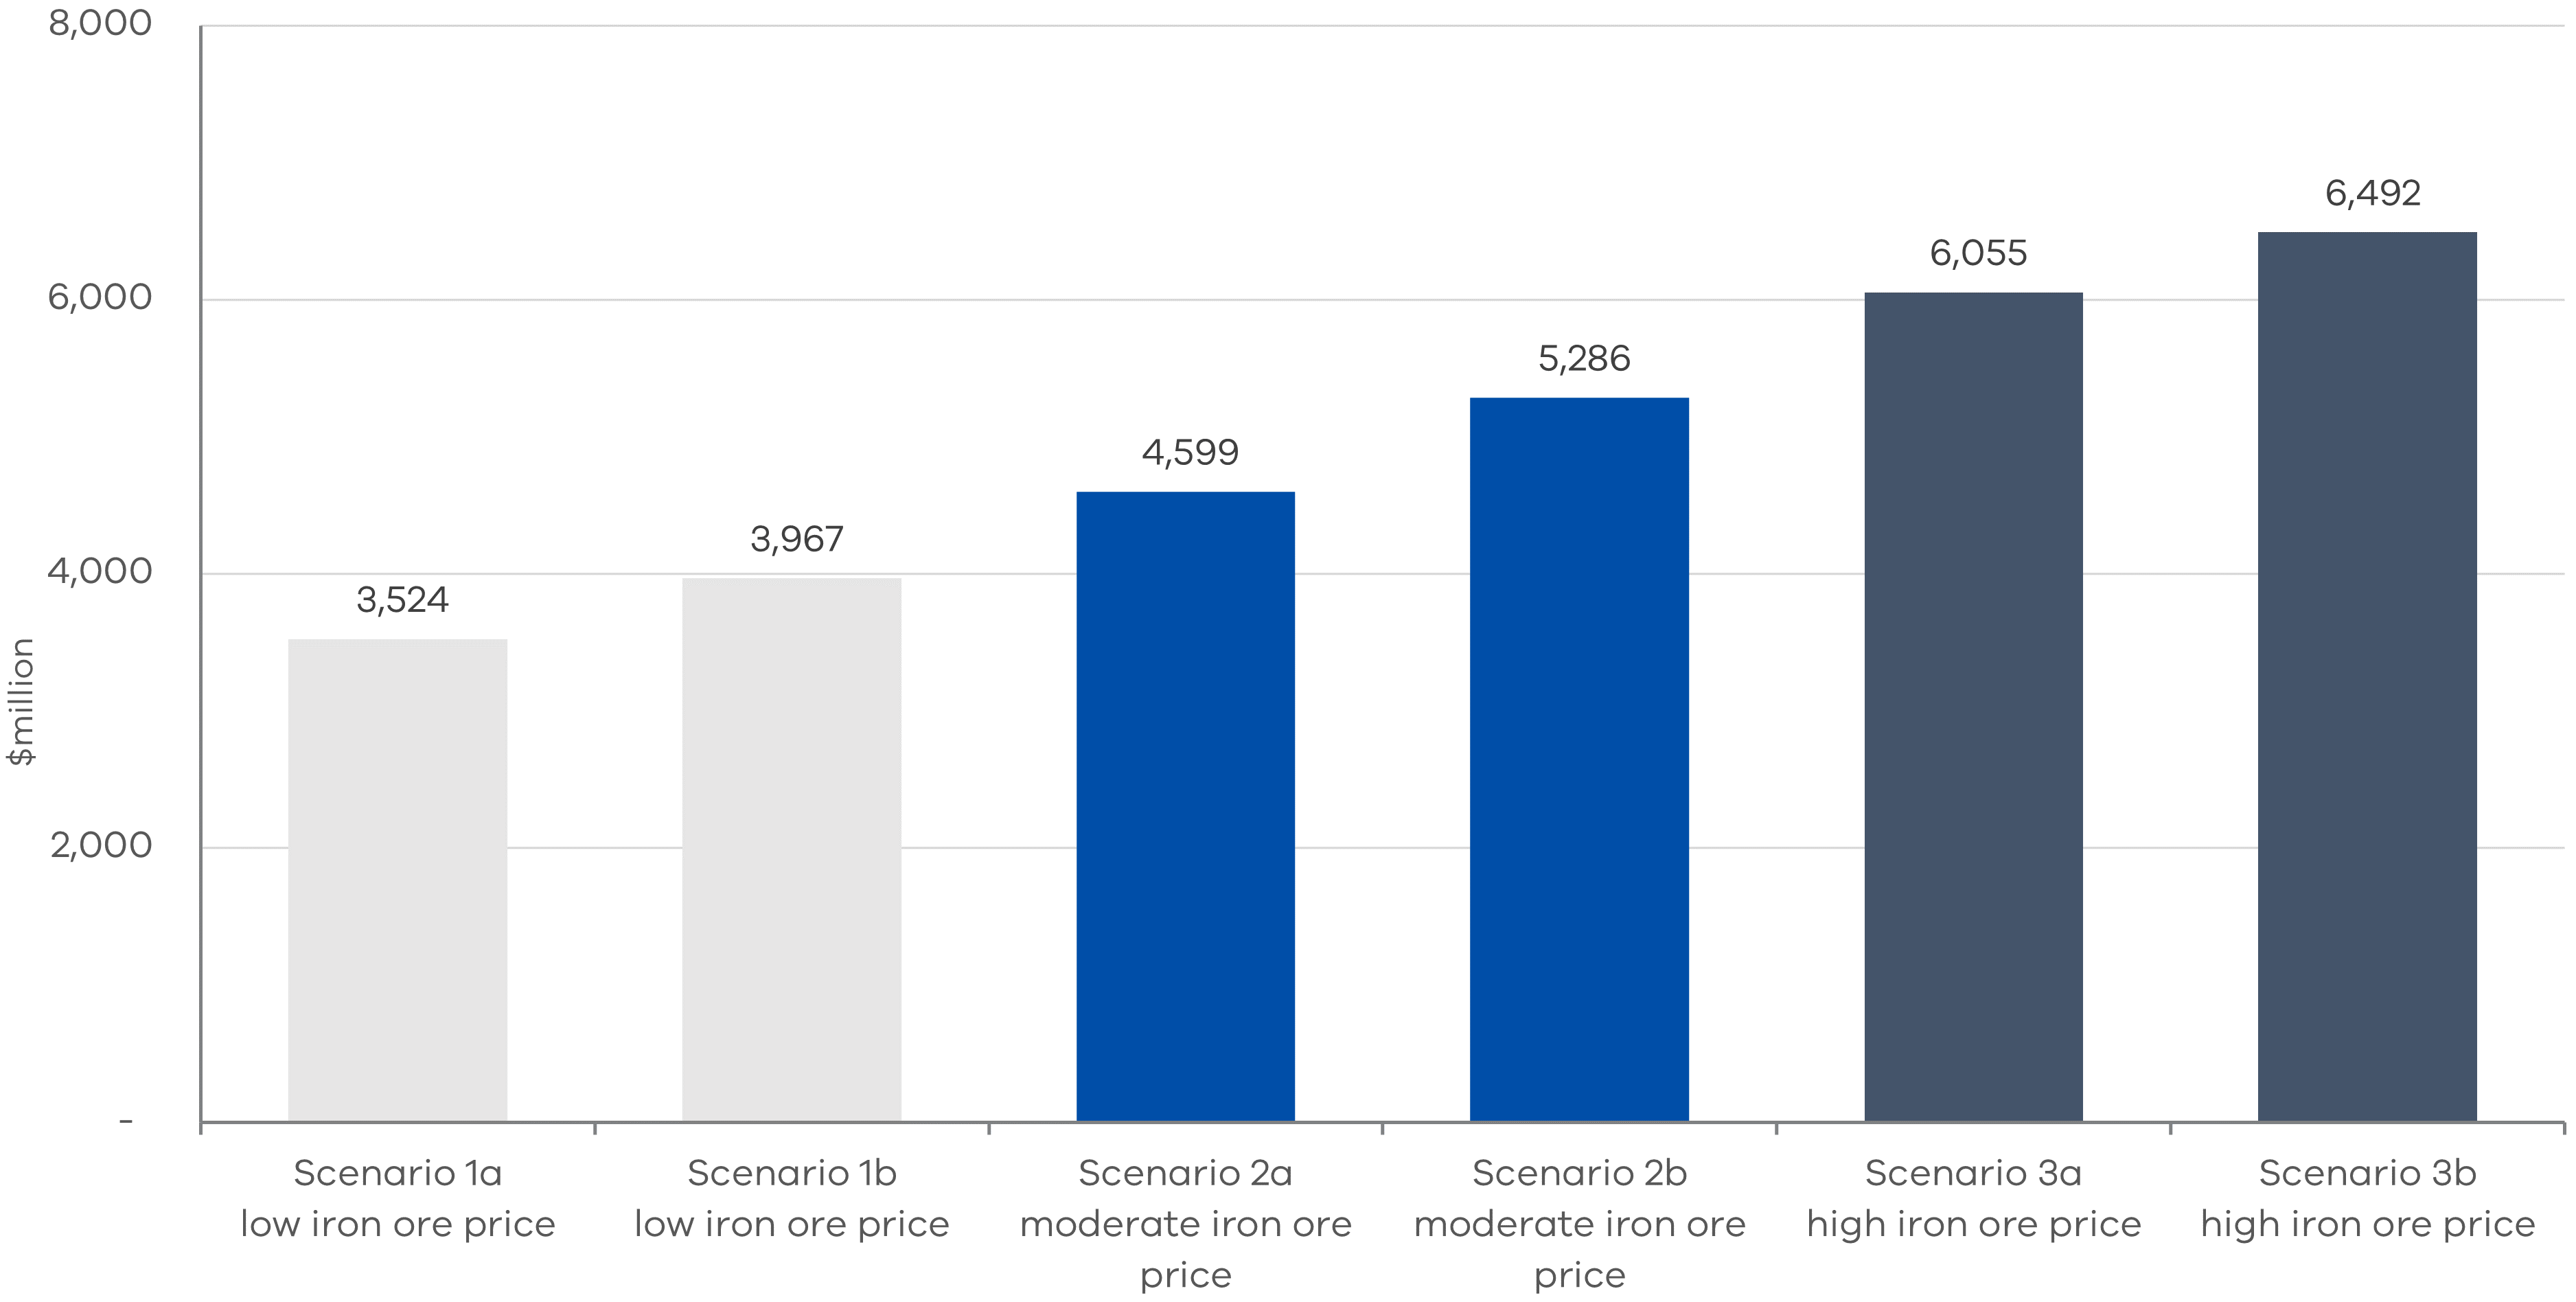
Under all the scenarios, Victoria is estimated to receive less GST under the new system compared to the former system, requiring supplementary no-worse-off payments to be made, shown in Table 2. Victoria is estimated to require no-worse-off payments of between $3.5 billion to $6.5 billion from 2021–22 to 2026–27 under the most and least favourable scenarios (scenarios 1a and 3b respectively).
Table 2: Estimated no-worse-off payments to Victoria under all scenarios modelled, $ millions
| Scenario | 2021–22 | 2022–23 | 2023–24 | 2024–25 | 2025–26 | 2026–27 | Total |
| Scenario 1a: low iron ore price | 55 | 1,145 | 1,230 | 855 | 245 | - | 3,525 |
| Scenario 2a: moderate iron ore price | 55 | 1,145 | 1,320 | 1,145 | 585 | 350 | 4,600 |
| Scenario 3a: high iron ore price | 55 | 1,145 | 1,460 | 1,510 | 1,025 | 870 | 6,055 |
| Scenario 1b: low iron ore price, multivariate | 50 | 1,120 | 1,320 | 990 | 485 | - | 3,965 |
| Scenario 2b: moderate iron ore price, multivariate | 55 | 1,150 | 1,420 | 1,295 | 825 | 535 | 5,285 |
| Scenario 3b: high iron ore price, multivariate | 55 | 1,185 | 1,515 | 1,575 | 1,135 | 1,020 | 6,490 |
Note: Figures have been rounded to the nearest $5 million.
Estimated no-worse-off payments, or the difference in GST distributions between the two systems, follow the same trends as expected from the relativities.
- Victoria would receive more no-worse-off payments under the high iron ore price scenarios 3a and 3b compared to the former system, owing to WA’s relativity being lower and requiring more GST to be lifted to the new equalisation standard or relativity floor.
- Victoria receives smaller no-worse-off payments when iron ore prices are low, as shown in scenarios 1a and 1b, when compared to the former system.
- Overall, Victoria requires no-worse-off payments in each scenario for all years under the new system, except for the final year in the low iron ore price scenarios 1a and 1b. This represents a very low iron ore price and an extreme outcome. Nonetheless, Victoria still receives no-worse-off payments for most years under this scenario and significant payments in aggregate over the period.
4.2 Comparison of simple and multivariable scenarios
Victoria is estimated to receive higher no-worse-off payments under the multivariate scenarios than the corresponding simple scenarios with the same iron ore price assumptions. For example, under scenarios with low iron ore prices, Victoria receives higher no-worse-off payments in the multivariate scenario 1b ($3.9 billion) than under the simple scenario 1a ($3.5 billion), demonstrated in Figure 7.
No-worse-off payments are higher in the multivariate scenarios, as overall WA’s relativity is slightly lower in all of the multivariant scenarios than in the corresponding simple scenarios with the same iron ore prices. Similarly, Victoria’s relativity is slightly higher under the multivariant scenarios.
This difference in relativities is partly due to different scenario approaches used, meaning the results are not directly comparable. Forecasts of LTD revenues, payroll tax revenue, population and population dispersion are based on budget publications in the simple scenarios, whereas they are assumed based on past growth rates in the multivariate scenarios.
For example, WA’s slightly lower relativity in the multivariate scenarios may partly be driven by the higher baseline forecasts of LTD and payroll tax revenues compared to the simple scenarios. This increases WA’s revenue raising capacity, decreases its relativity and causes Victoria to require more no-worse-off payments.
Figure 7: Estimated no-worse-off payments to Victoria under all six scenarios

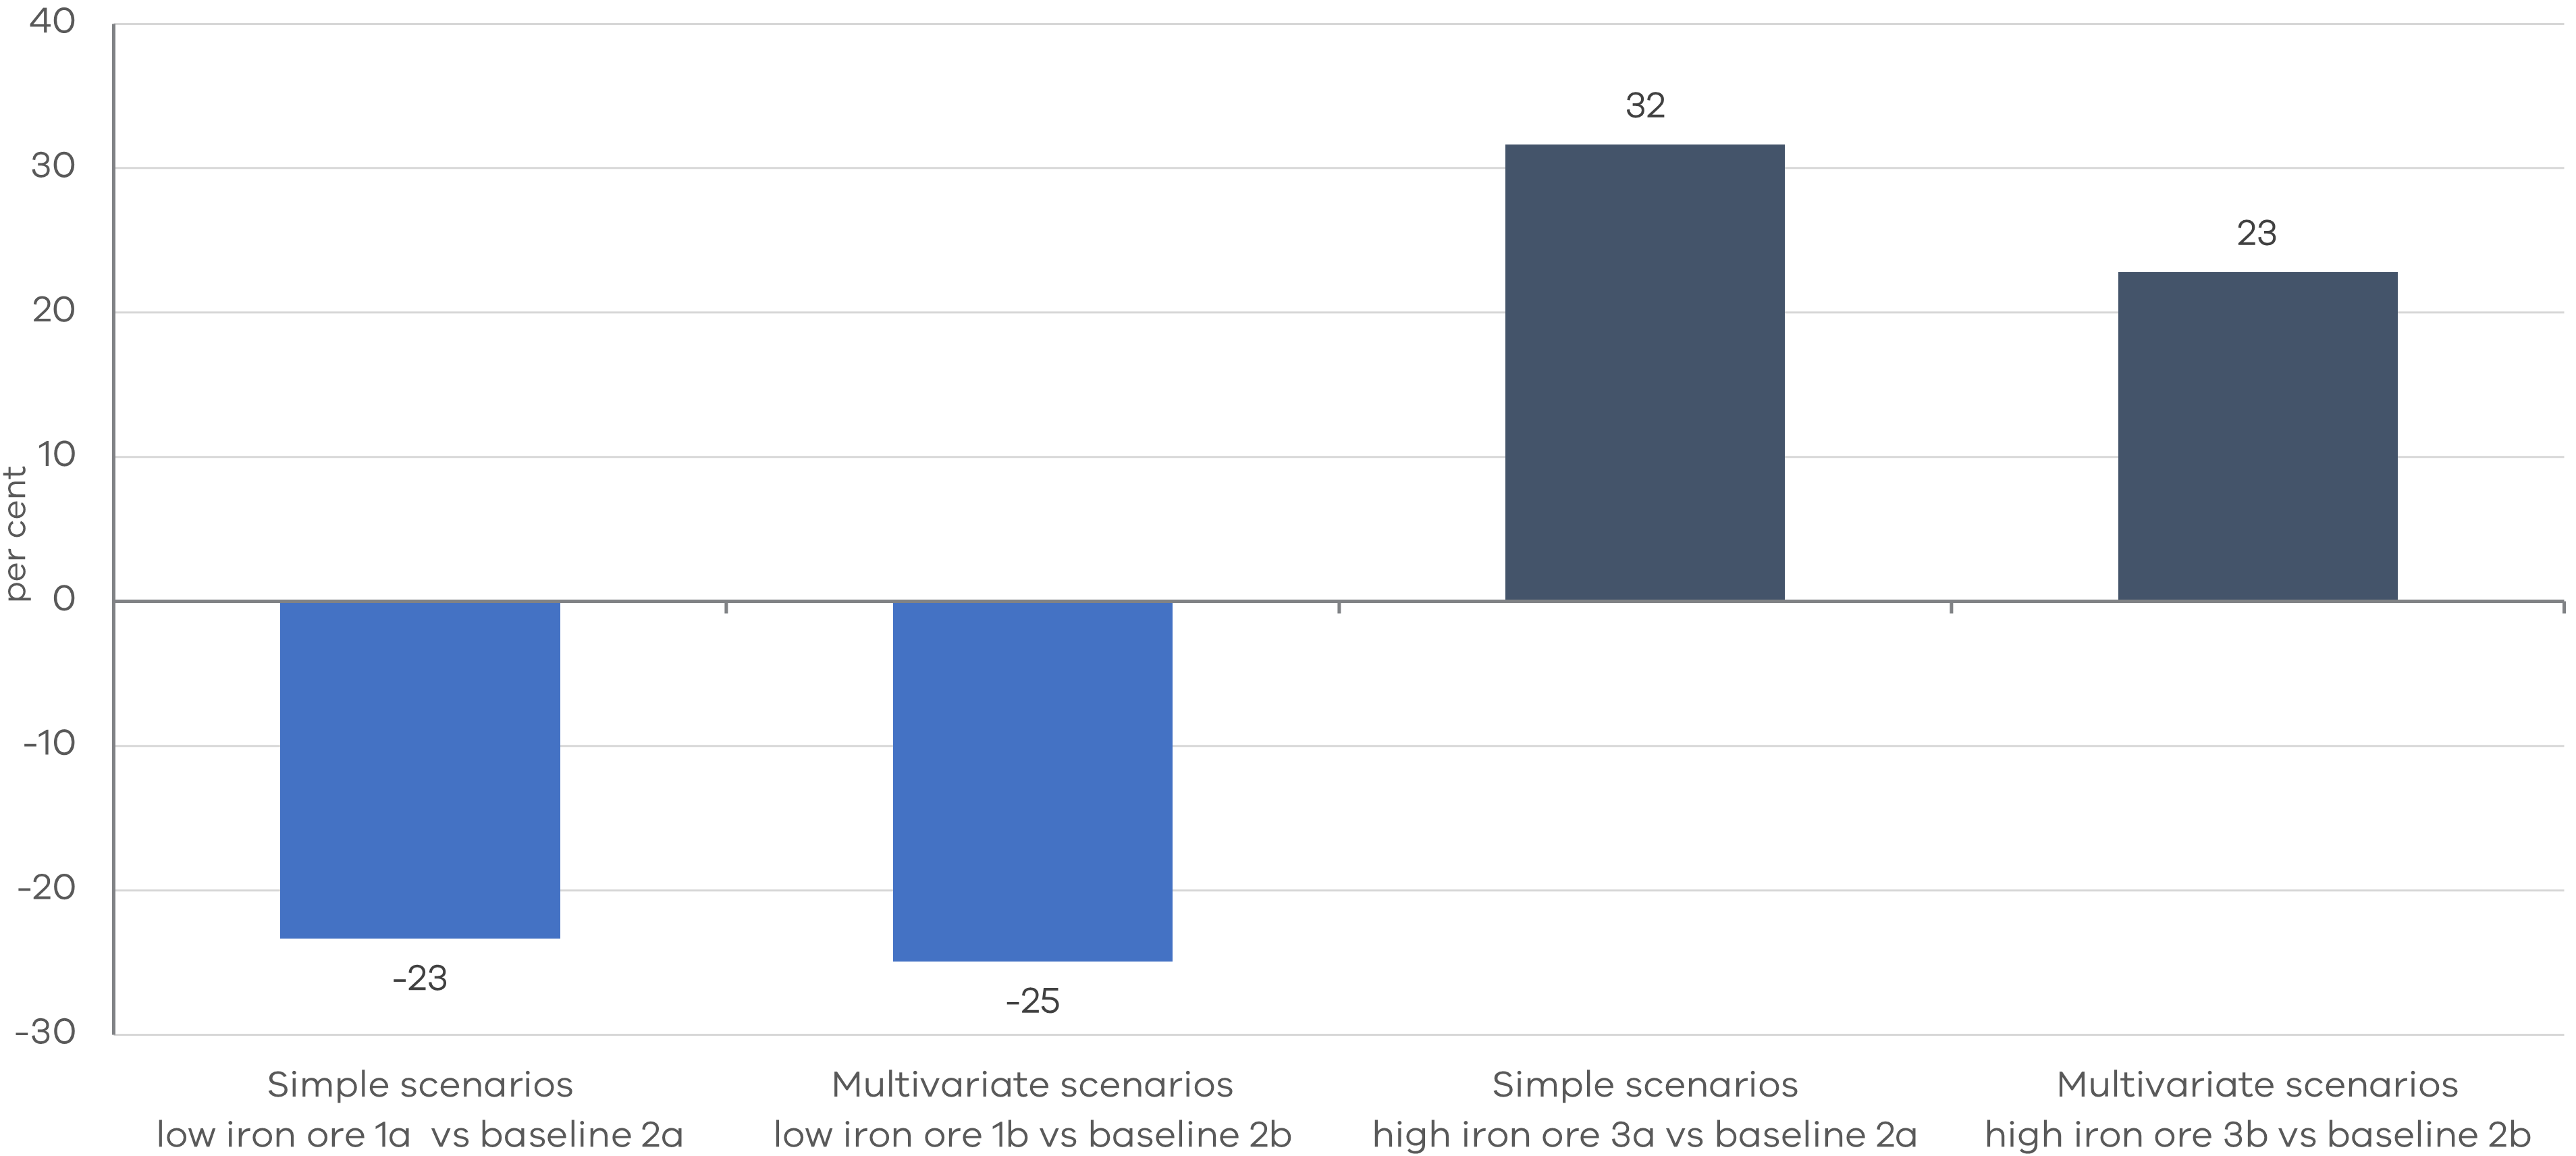
Therefore, to test the effect of the variables introduced in the multivariate scenarios on estimated no-worse-off payments, we compare the proportional differences of the low and high iron ore scenarios under the simple and multivariate methods to the moderate scenarios 2a and 2b, which are used as a ‘baseline’. We do this by calculating the percentage difference of the high and low scenarios to the moderate scenarios under the simple and multivariate approaches.
Under the simple and multivariate high iron ore price scenarios, 3a and 3b respectively, Victoria receives larger no-worse-off payments than in the respective moderate scenarios under the simple and multivariate methods 2a and 2b. This is expected, because as iron ore prices rise, WA’s relativity drops. However, this advantage is retained under the new system because of the new standard of equalisation and the relativity floor, at the expense of Victoria and other states losing GST share. These outcomes are demonstrated in Figure 7 above for the simple and multivariate approaches.
Figure 8: Proportionate differences in no-worse-off payments to Victoria between baseline scenarios and high and low iron ore price scenarios

Compared to the simple scenarios, the multivariable method introduces factors that compound the impact of iron ore prices on no-worse-off payments (changes in LTD and payroll tax revenue) and those that counteract it (changes in population and population dispersion).
LTD and payroll tax revenue compound the effect of iron ore prices and mining revenues as they are assumed in the multivariate scenarios to move in the same way. In the high iron prices multivariate Scenario 3b, LTD and payroll tax revenue in WA grow at historically high rates. This increases WA’s revenue raising capacity, reducing its GST requirement, which in turn increases the impact of the new system and no-worse-off payments for Victoria.
Population and population dispersion are also assumed to grow at higher rates in WA with high iron ore prices under Scenario 3b, as discussed above, simulating population growing in mining areas spurred by greater economic opportunities. This increases cost pressures for WA and so its GST requirement. As such, the impact of the new system and no-worse-off payments to Victoria are reduced.
Figure 8 shows that in combination, the introduction of the new variables in the multivariable scenarios means the difference between the high (3b) and baseline (2b) iron ore scenarios is less than that between equivalent simple scenarios (3a and 2a). Compared to the moderate scenario baselines, no-worse-off payments are 32 per cent higher in the simple Scenario 3a, compared to 23 per cent higher in the multivariate Scenario 3b.
As such, for the particular set of circumstances assumed in this scenario, population growth and population dispersion, which limited the extent to which iron ore prices reduced no-worse-off payments for Victoria, have a greater impact on the modelling than payroll tax and land transfer duty.
The same is true in the opposite direction under the low iron ore price scenarios, also shown in Figure 8. Victoria’s no-worse-off payments are proportionately higher compared to the baseline scenarios under the multivariable method for low iron ore prices 1b (see Figure 8). This means population and population dispersion are counteracting the impact of land transfer duty and payroll tax.
4.3 GST relativities under the former system
The estimated GST relativities under the former system for Victoria, NSW and WA are presented below for each of the scenarios estimated, 1a through 3b. Relativities under the former system are presented to show the effect of the scenarios on states’ fiscal capacities directly. The financial impacts on Victoria, or dollar value impact, of the new system, presented in the section above, are derived from these changes to states’ fiscal capacities.
Victoria, NSW and WA’s relativities are presented as they are the focus of the scenario modelling. WA’s relativity is also presented, as the impact of the new GST system to Victoria in the medium term is largely dependent on WA’s relativity. WA is the only state with a relativity currently below the relativity floor and Victoria and NSW’s relativities. This creates a disadvantage to Victoria under the new GST system compared to the former, as it no longer gains GST to raise it to WA’s higher fiscal standard.
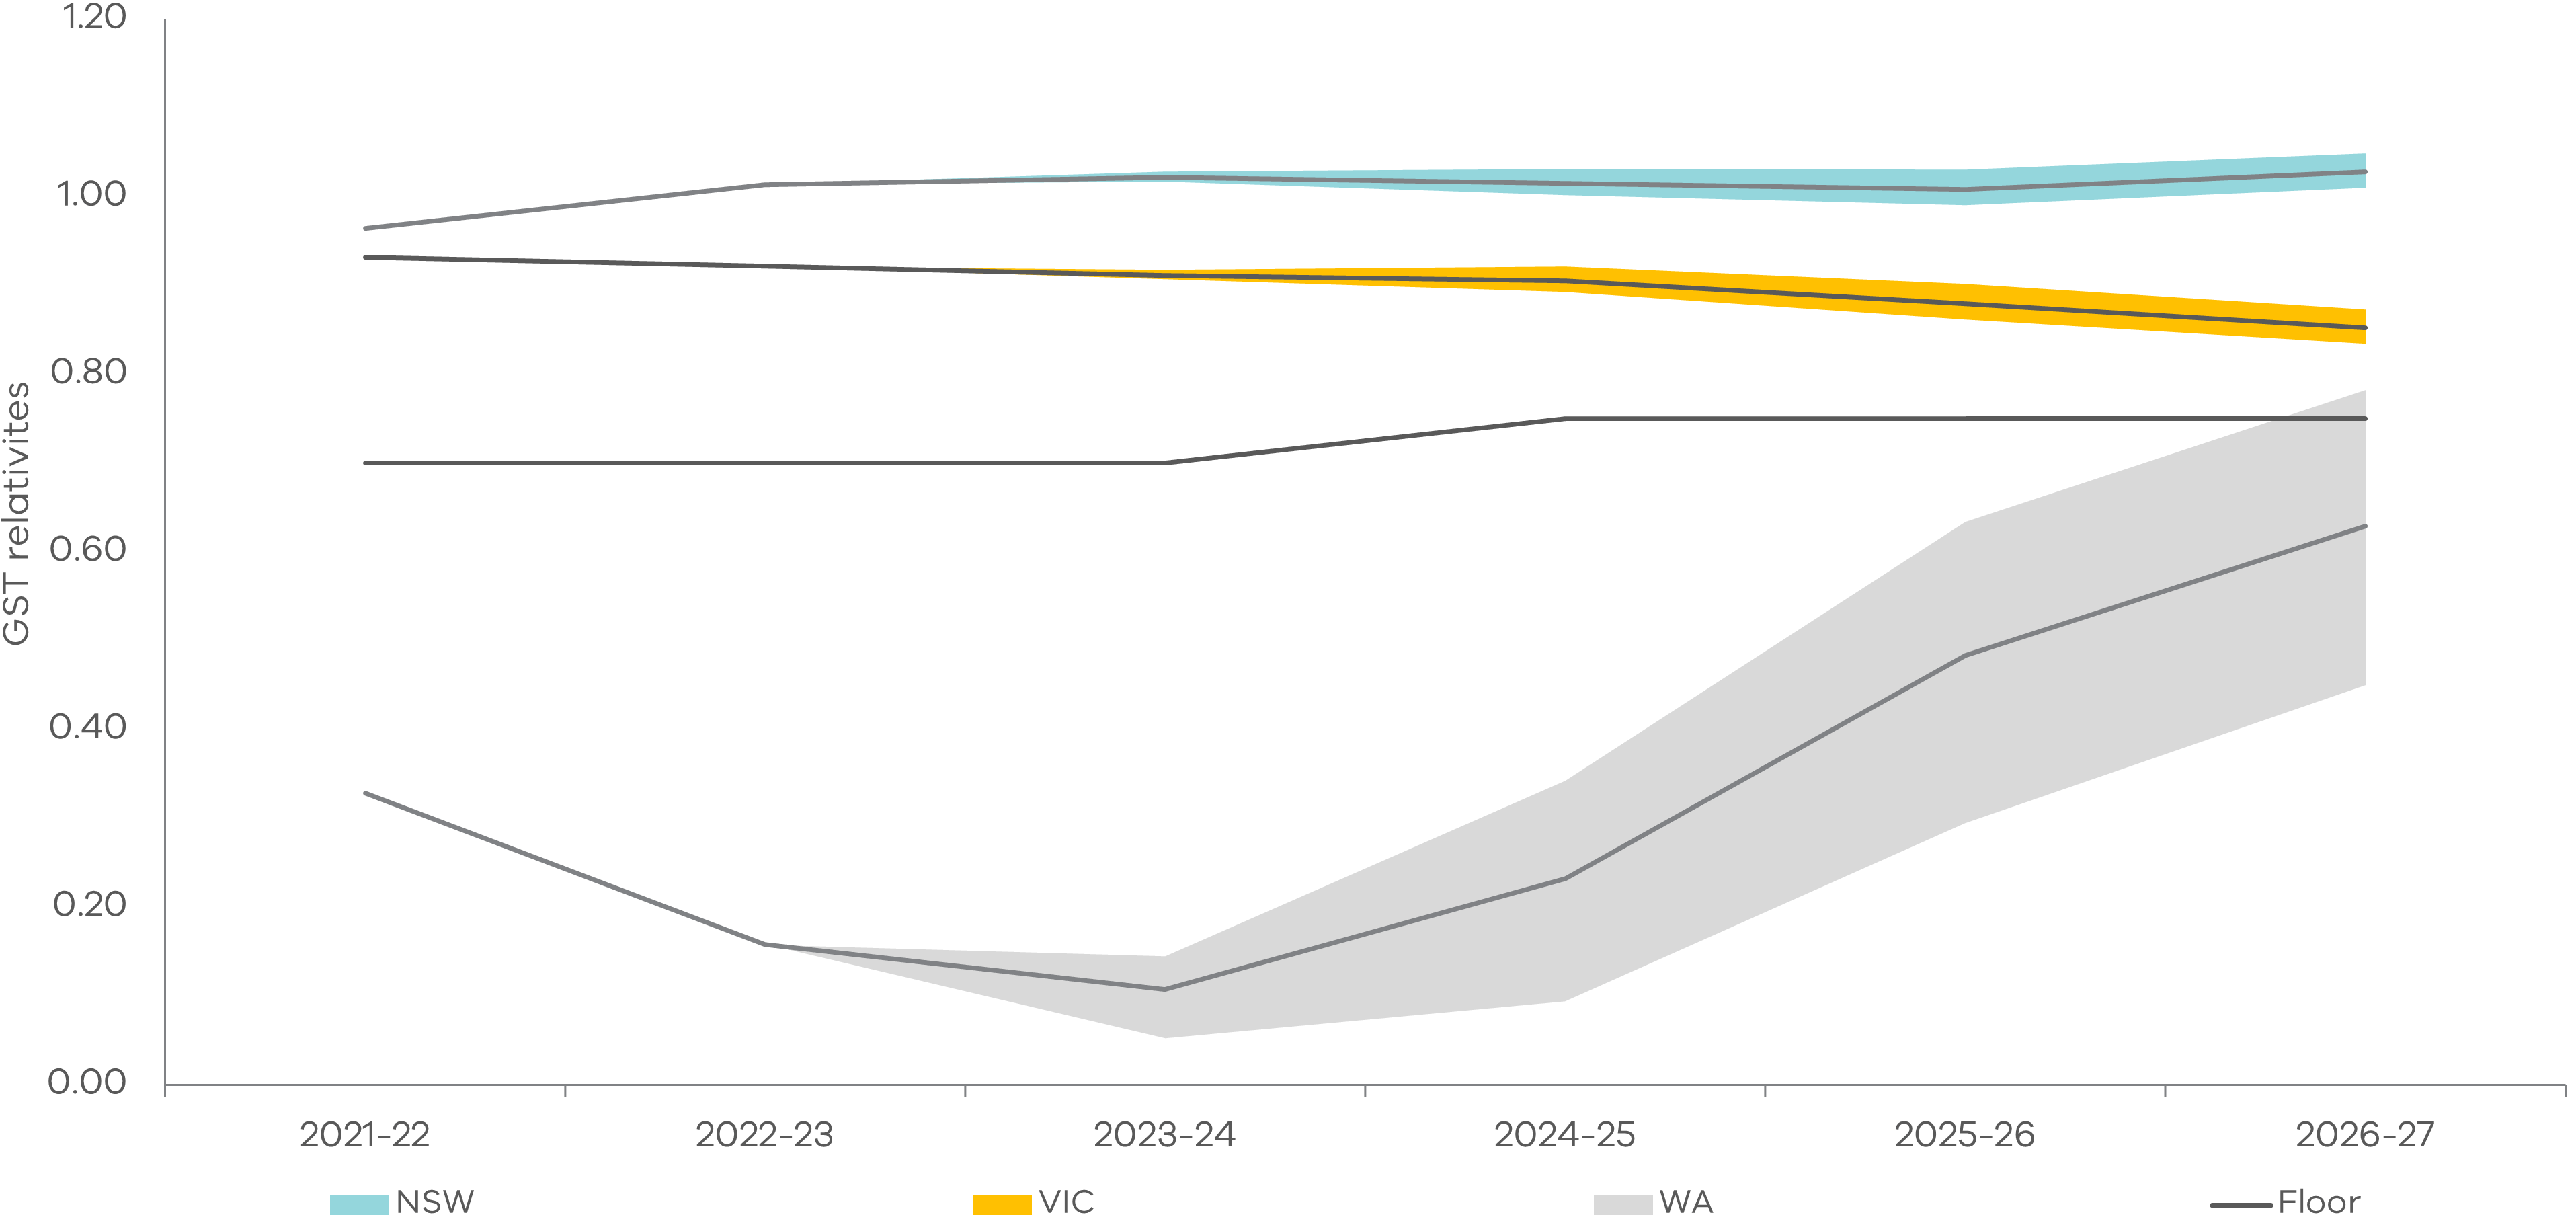
Under all three of the simple scenarios – 1a, 2a and 3a – WA’s relativity increases over time until 2026–27, as the iron ore price is expected to fall across all forecasts, shown in Figure 7. Conversely, Victoria and NSW’s relativities decline as iron ore prices fall. This is expected, as lower iron ore prices mean WA receives less own-source mining royalty revenue and as such requires more GST, reflected in a higher relativity.
WA’s relativity rises more under Scenario 1a with the lowest iron ore prices, than under Scenario 3a with higher iron ore prices. The opposite occurs for Victoria and NSW. We anticipated this outcome, as a lower iron ore price implies lower mining revenue for WA and a greater need for GST funding reflected in a higher GST relativity.
WA’s relativity falls below the floor introduced by the new GST system in all scenarios in all years, except for the final year of the ‘low’ iron ore price scenarios (scenarios 1a and 1b). It is always below both NSW and Victoria’s GST relativities.
The results demonstrate that there is a wide range of potential outcomes in terms of GST relativities from the iron ore forecasts selected. The results suggest it is likely Victoria would require supplementary payments to ensure it is not disadvantaged under the new GST system.
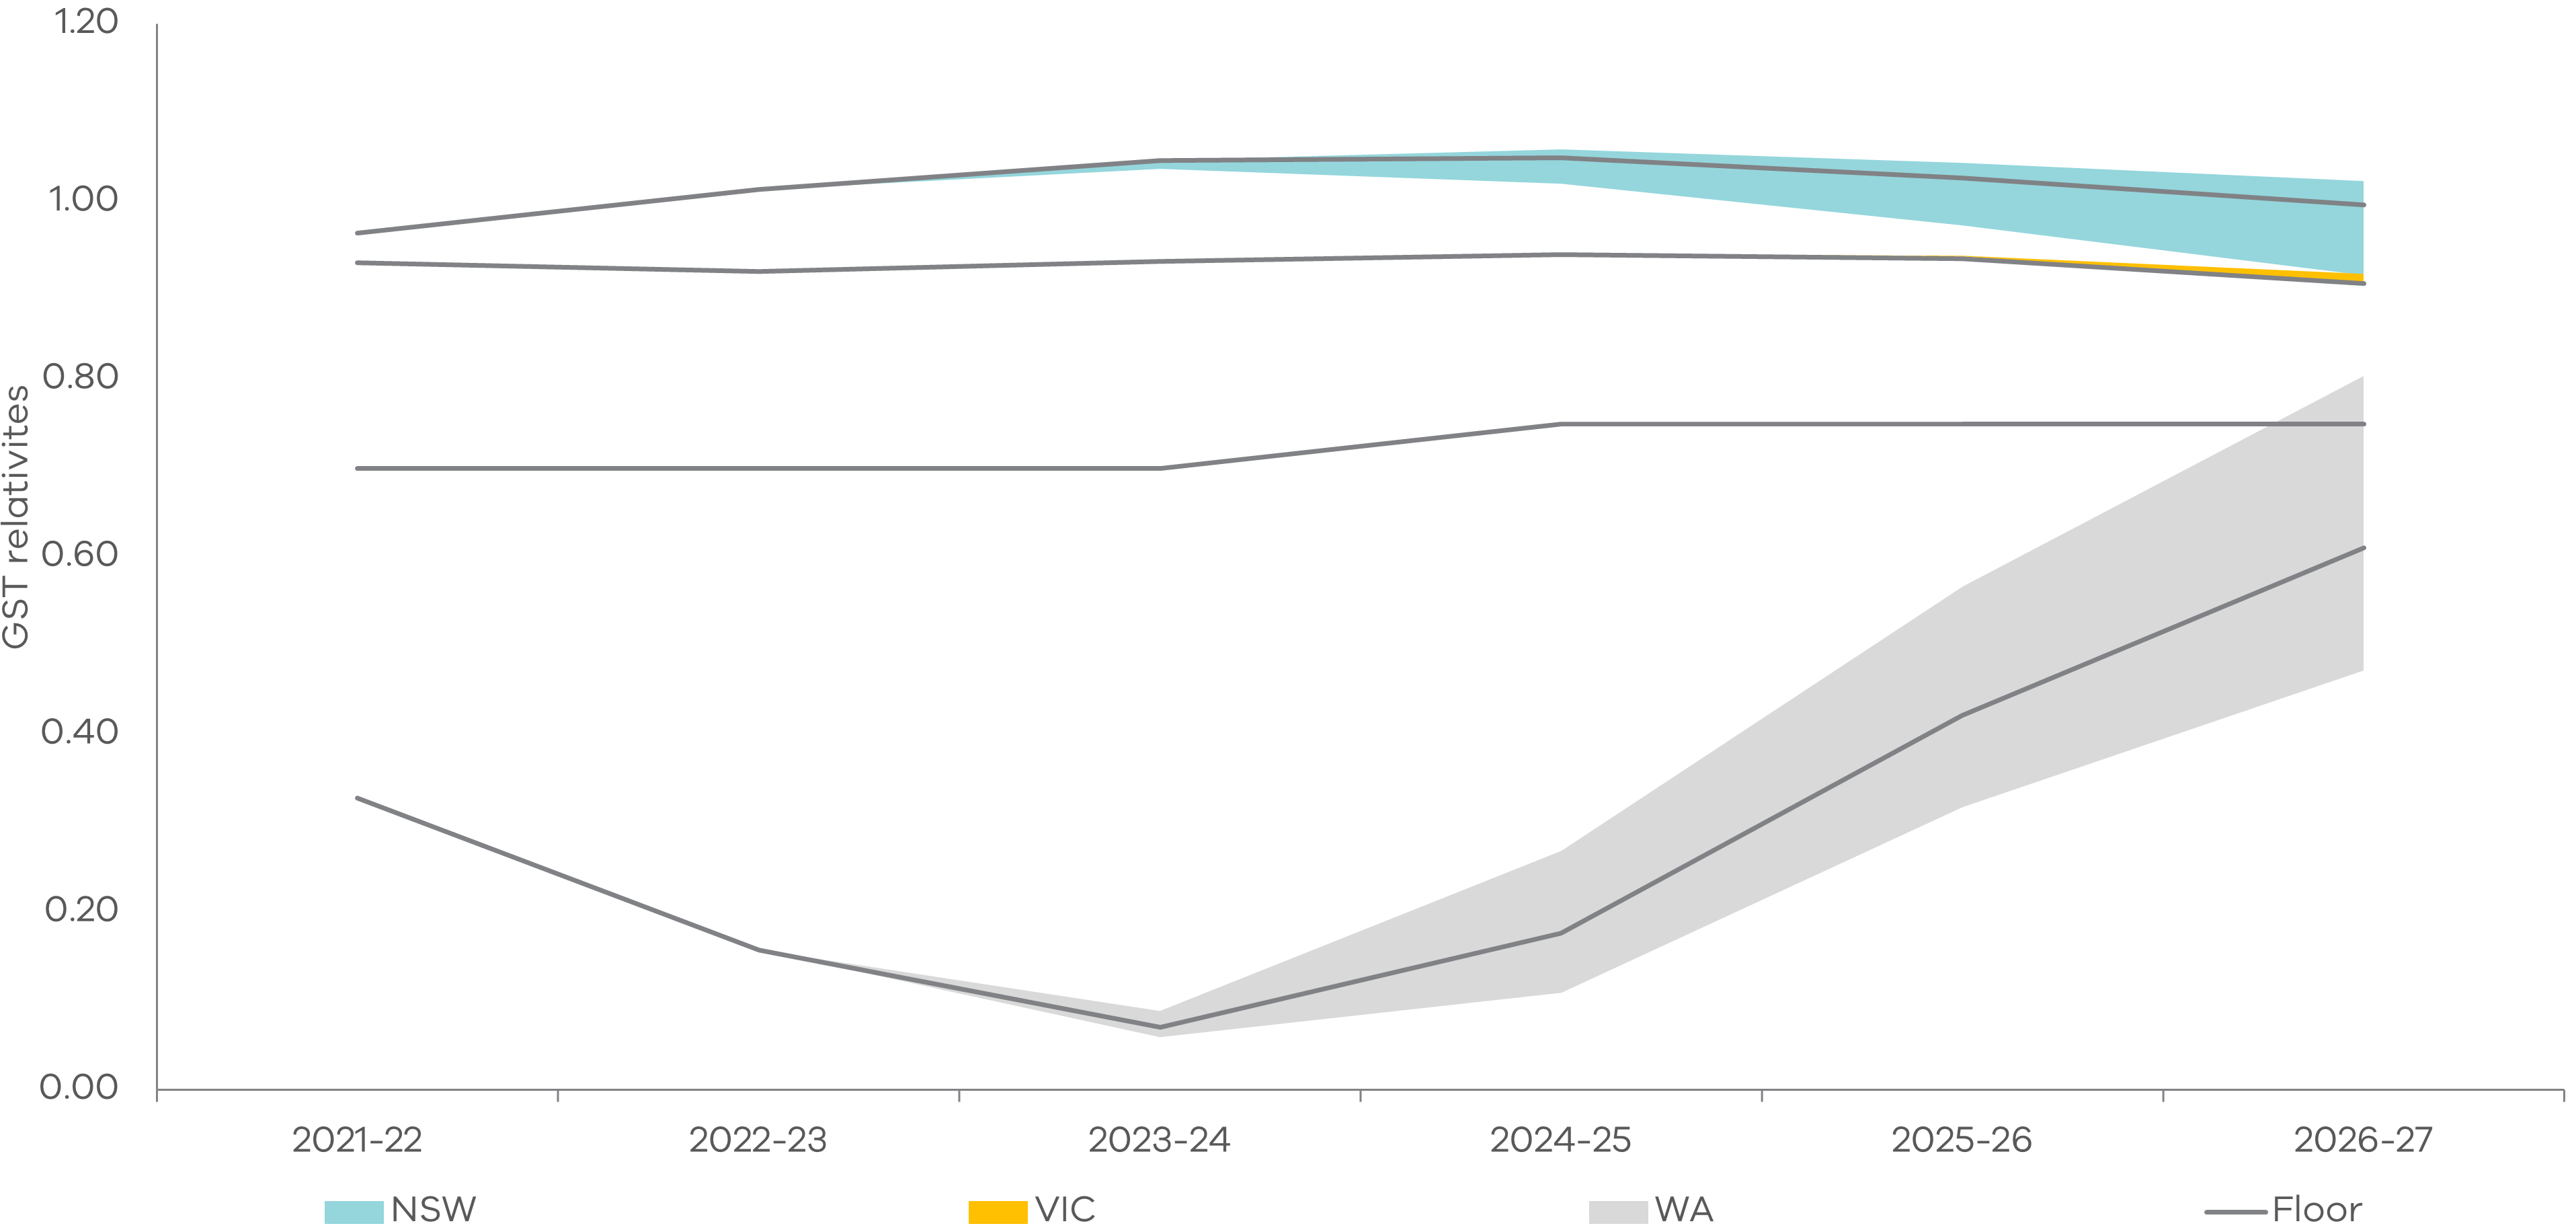
Results from the multivariate scenarios show the same general trends, as demonstrated in Figure 10.
Figure 9: GST relativities under simple scenarios 1a, 2a and 3a

Note: For NSW and Victoria, the upper range represents Scenario 3a or high iron ore prices, while the lower range represents Scenario 1a or low iron ore prices. This is inverted for WA, where the lower range is Scenario 3a or high iron ore prices, while the upper range is Scenario 1a with low iron ore prices.
Figure 10: GST relativities under multivariate scenarios 1b, 2b and 3b

Note: For NSW and Victoria, the upper range represents Scenario 3b or high iron ore prices, while the lower range represents Scenario 1b or low iron ore prices. This is inverted for WA, where the lower range is Scenario 3b or high iron ore prices, while the upper range is Scenario 1b with low iron ore prices.
Updated

