Recall that KM estimates measure the fraction of subjects who survive an event for a certain amount of survival time t. In our case, the spell of interest is the period of unemployment, and, in the initial case, we are modelling the time it takes for individuals to find a full-time job after obtaining their tertiary degree.
Figure 2 and Figure 3 present the KM survival probabilities curve for the total sample population and for gender groups, respectively. The y-axis refers to the probabilities of surviving the unemployment spell, S(t), and the x-axis represents the years after completion of their tertiary qualification. In Figure 2, the survival curve is a downward sloping step function, where the rate of decrease is largest in the earliest period and gradually tapers off over time. This shape conforms to what we would normally expect of new graduates who, due to their inexperience, face significant hurdles as they enter the labour market in search of full-time jobs. Often, new graduates take on internships, traineeships, or fixed period graduate positions after graduation – many take temporary part-time jobs and/or continue to study until they secure full-time jobs. These temporary arrangements can continue for a period of time, but can provide new graduates the essential marketplace experience that can improve their practical skills and increase their chances of landing a full-time job. The KM analysis indicates these improving chances through these survival probabilities: fresh graduates have a 41 per cent chance of ‘surviving’ unemployment or remaining unemployed in the first year following graduation, falling to 27 per cent in the second year, then to 20 per cent in the third year and so on.1 These survival probabilities and the associated survival curve will serve as our benchmark as we move on and undertake analysis using a gendered approach.
Figure 2: K-M survival probabilities, all people
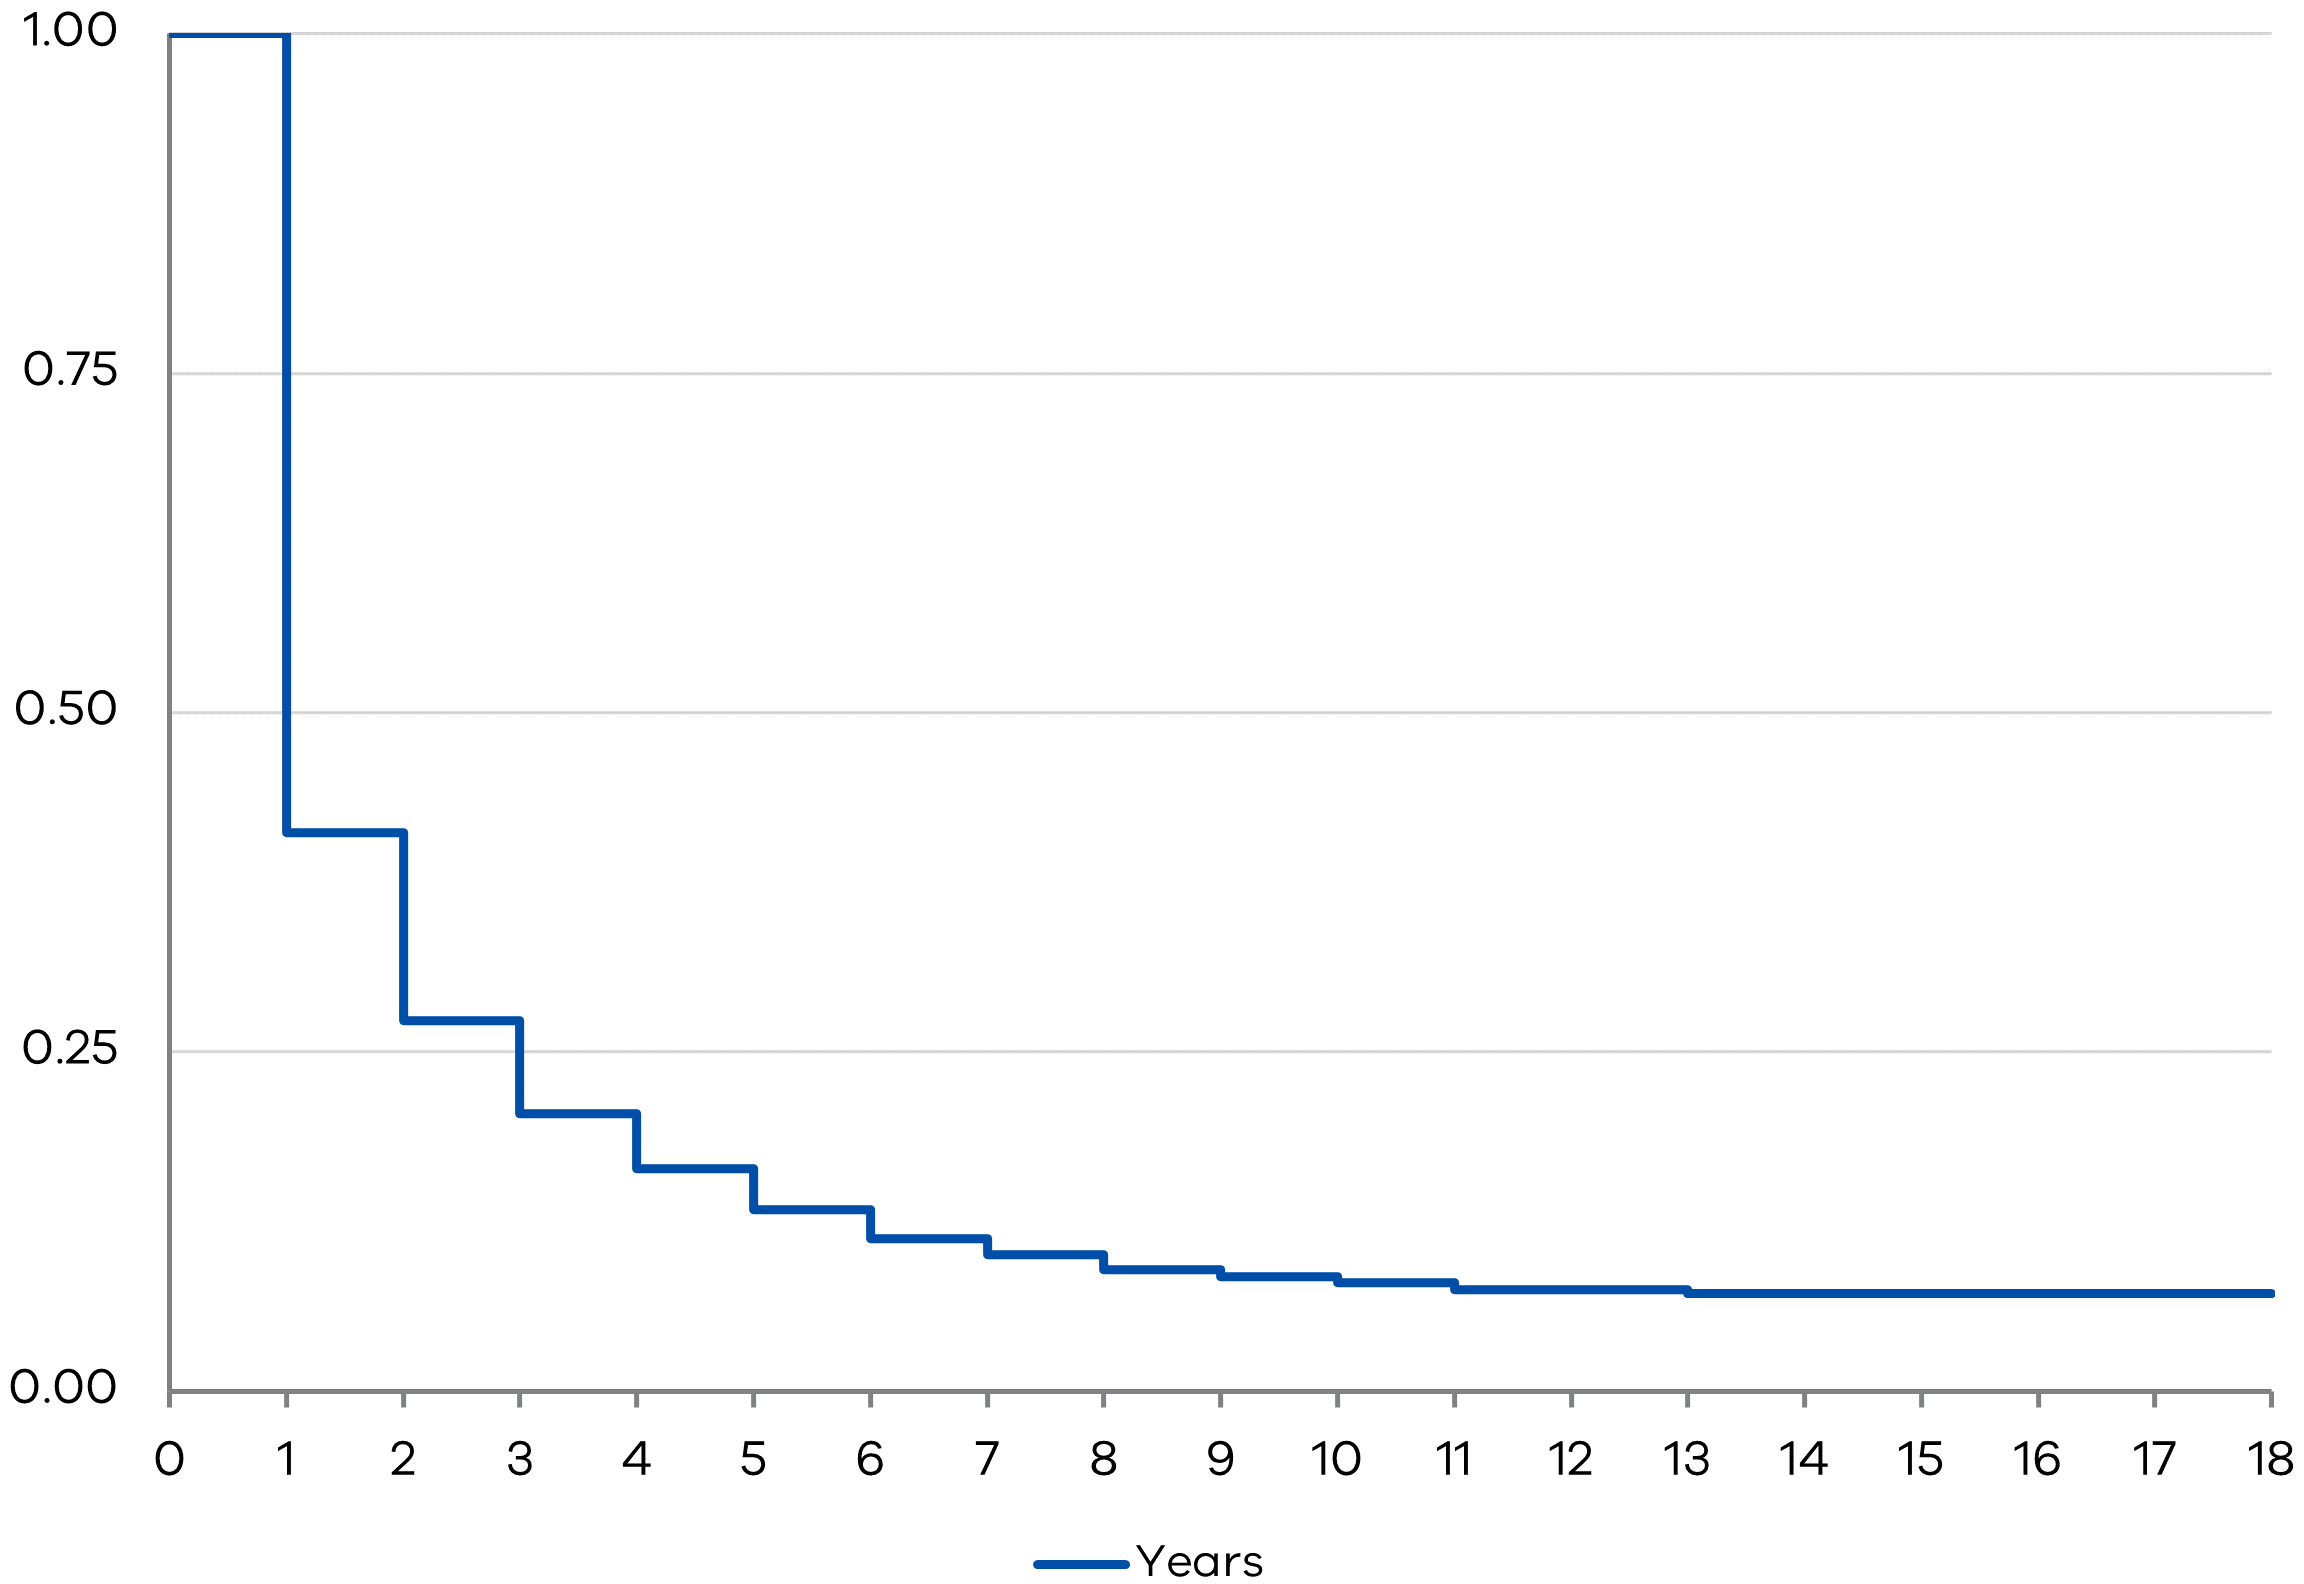
Figure 3: Survival estimates by gender
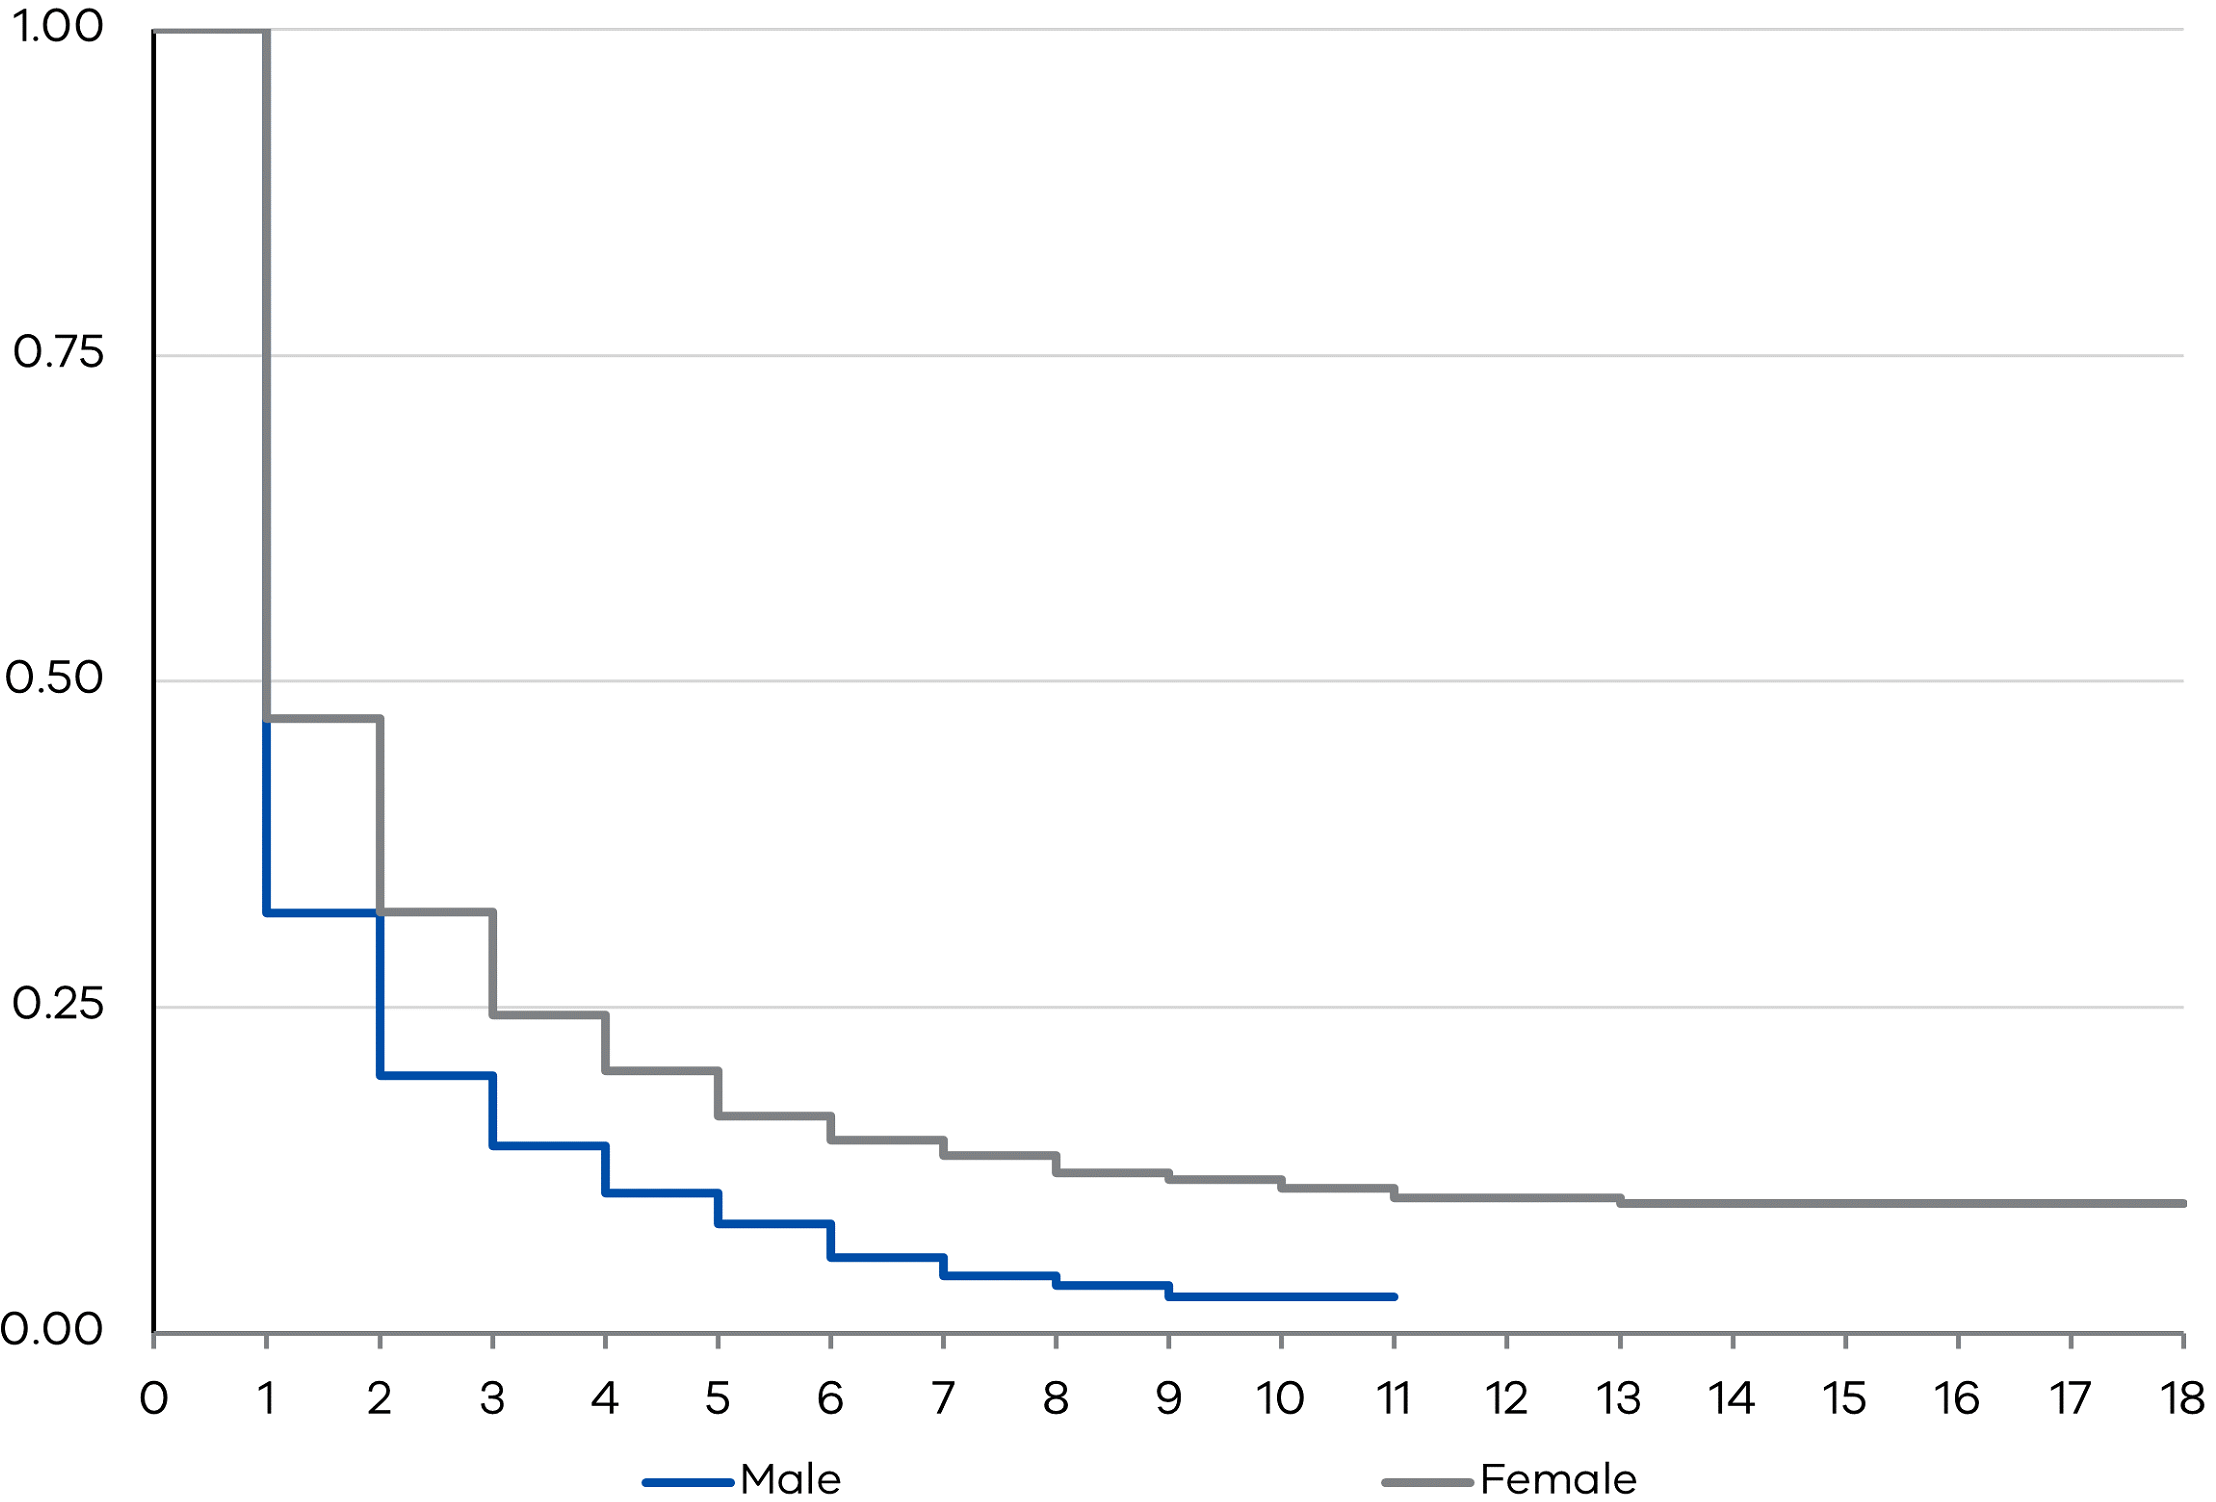
Figure 3 presents the KM survival curves for men and women. It is immediately evident that the curve for women (red) sits above the curve for men all through time. This indicates that women graduates have higher ‘survival’ rates at each time point. In other words, new women graduates took significantly more time landing full-time jobs compared to new men graduates. In more specific terms, new women graduates are shown to have a 47 per cent chance of staying (full-time) unemployed at the end of the first year, compared to just 32 per cent chance for new men graduates. In the second year, the chances of gaining full-time employment improves for both genders, but the survival rate differential is still very wide – 32 per cent chance of remaining unemployed for women compared to just 20 per cent chance for men. In the third year, the probability of finding a full-time job continues to improve for both groups but the gap in survival rates remains large: 24 per cent for women to just 14 per cent for men. These findings point not just to a significant gender gap in the labour market entry outcomes for new tertiary graduates, but also shows that these gaps can persist over years.
Our KM-based analysis is next applied to the sample grouped by common characteristics such as age, location, country of birth, marital status, parental status and gender. We find that age plays a different role for men and women. Figure 4 shows that among women who just completed a tertiary degree, those aged 40 and over appeared to take a longer time to find full-time employment compared to those aged under 40. In contrast, newly qualified older men appear to find full-time jobs quicker than their younger counterparts, with a gap of 16 percentage points in the first year, and nine percentage points in the second year. We also find that, given time, full-time employment probabilities for older and younger men converge, but we find no similar convergence in the employment probabilities for older and younger women.
Figure 4a: K-M survival probabilities by gender and age
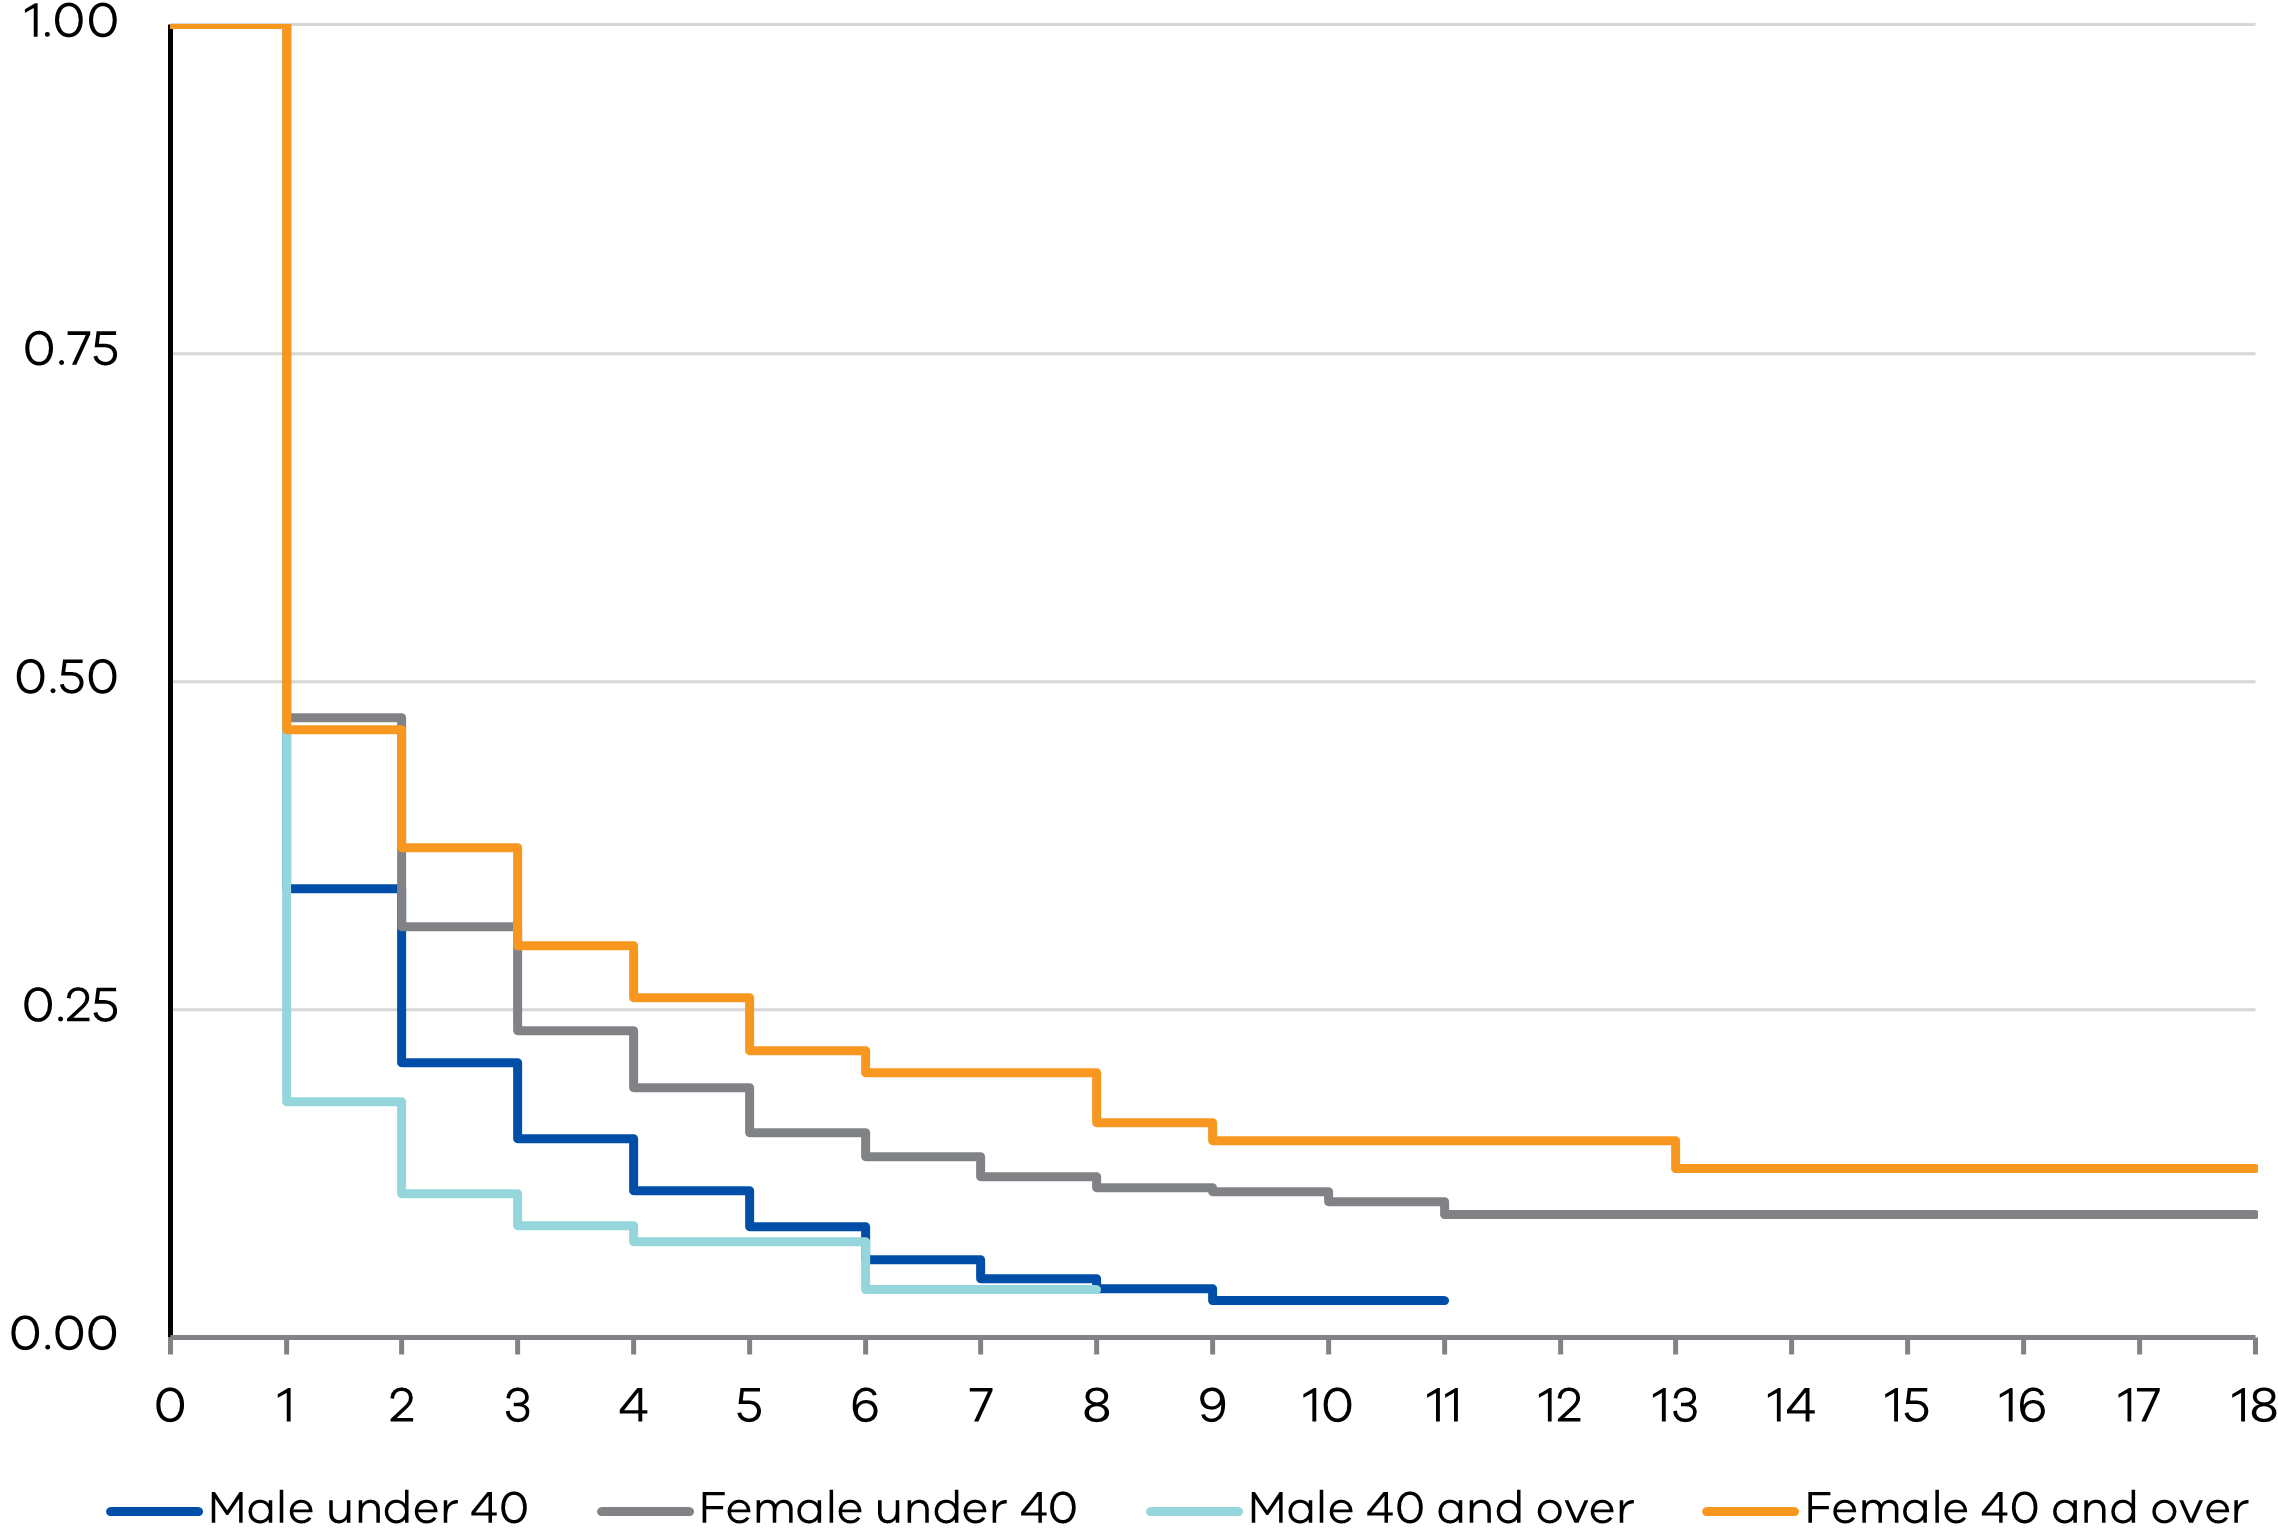
Figure 4b: K-M survival probabilities by gender and urbanity
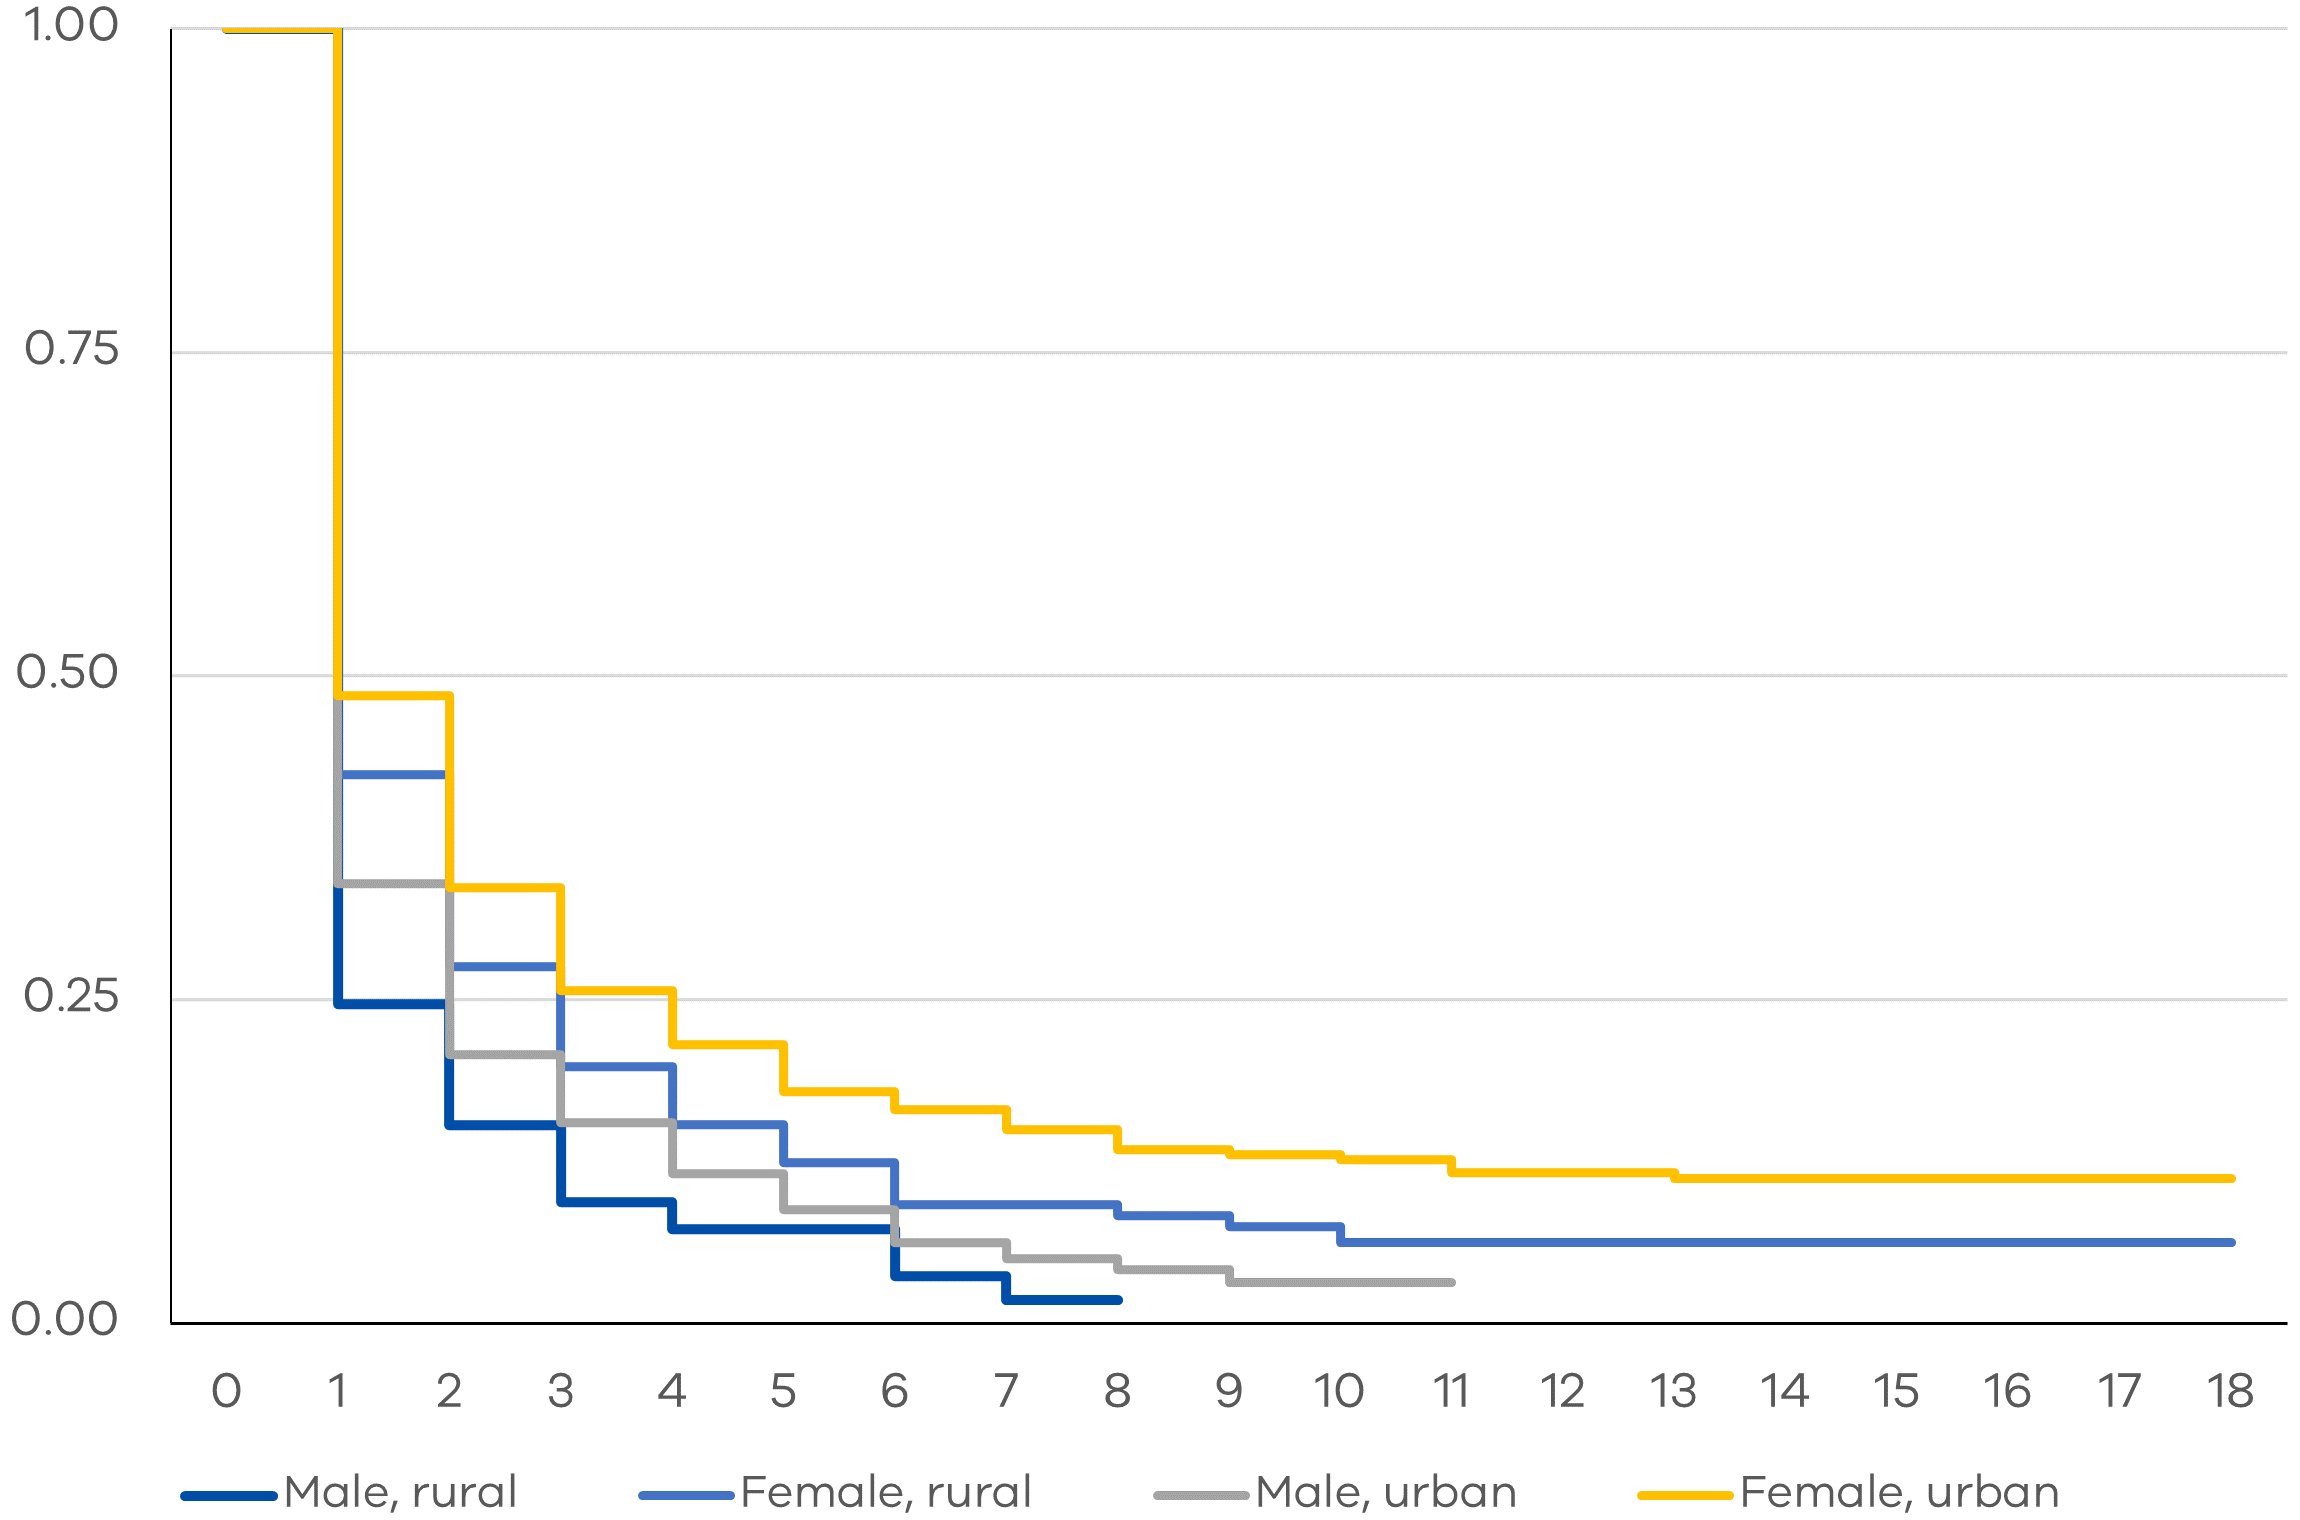
Figure 4c: K-M survival probabilities by gender and country of birth
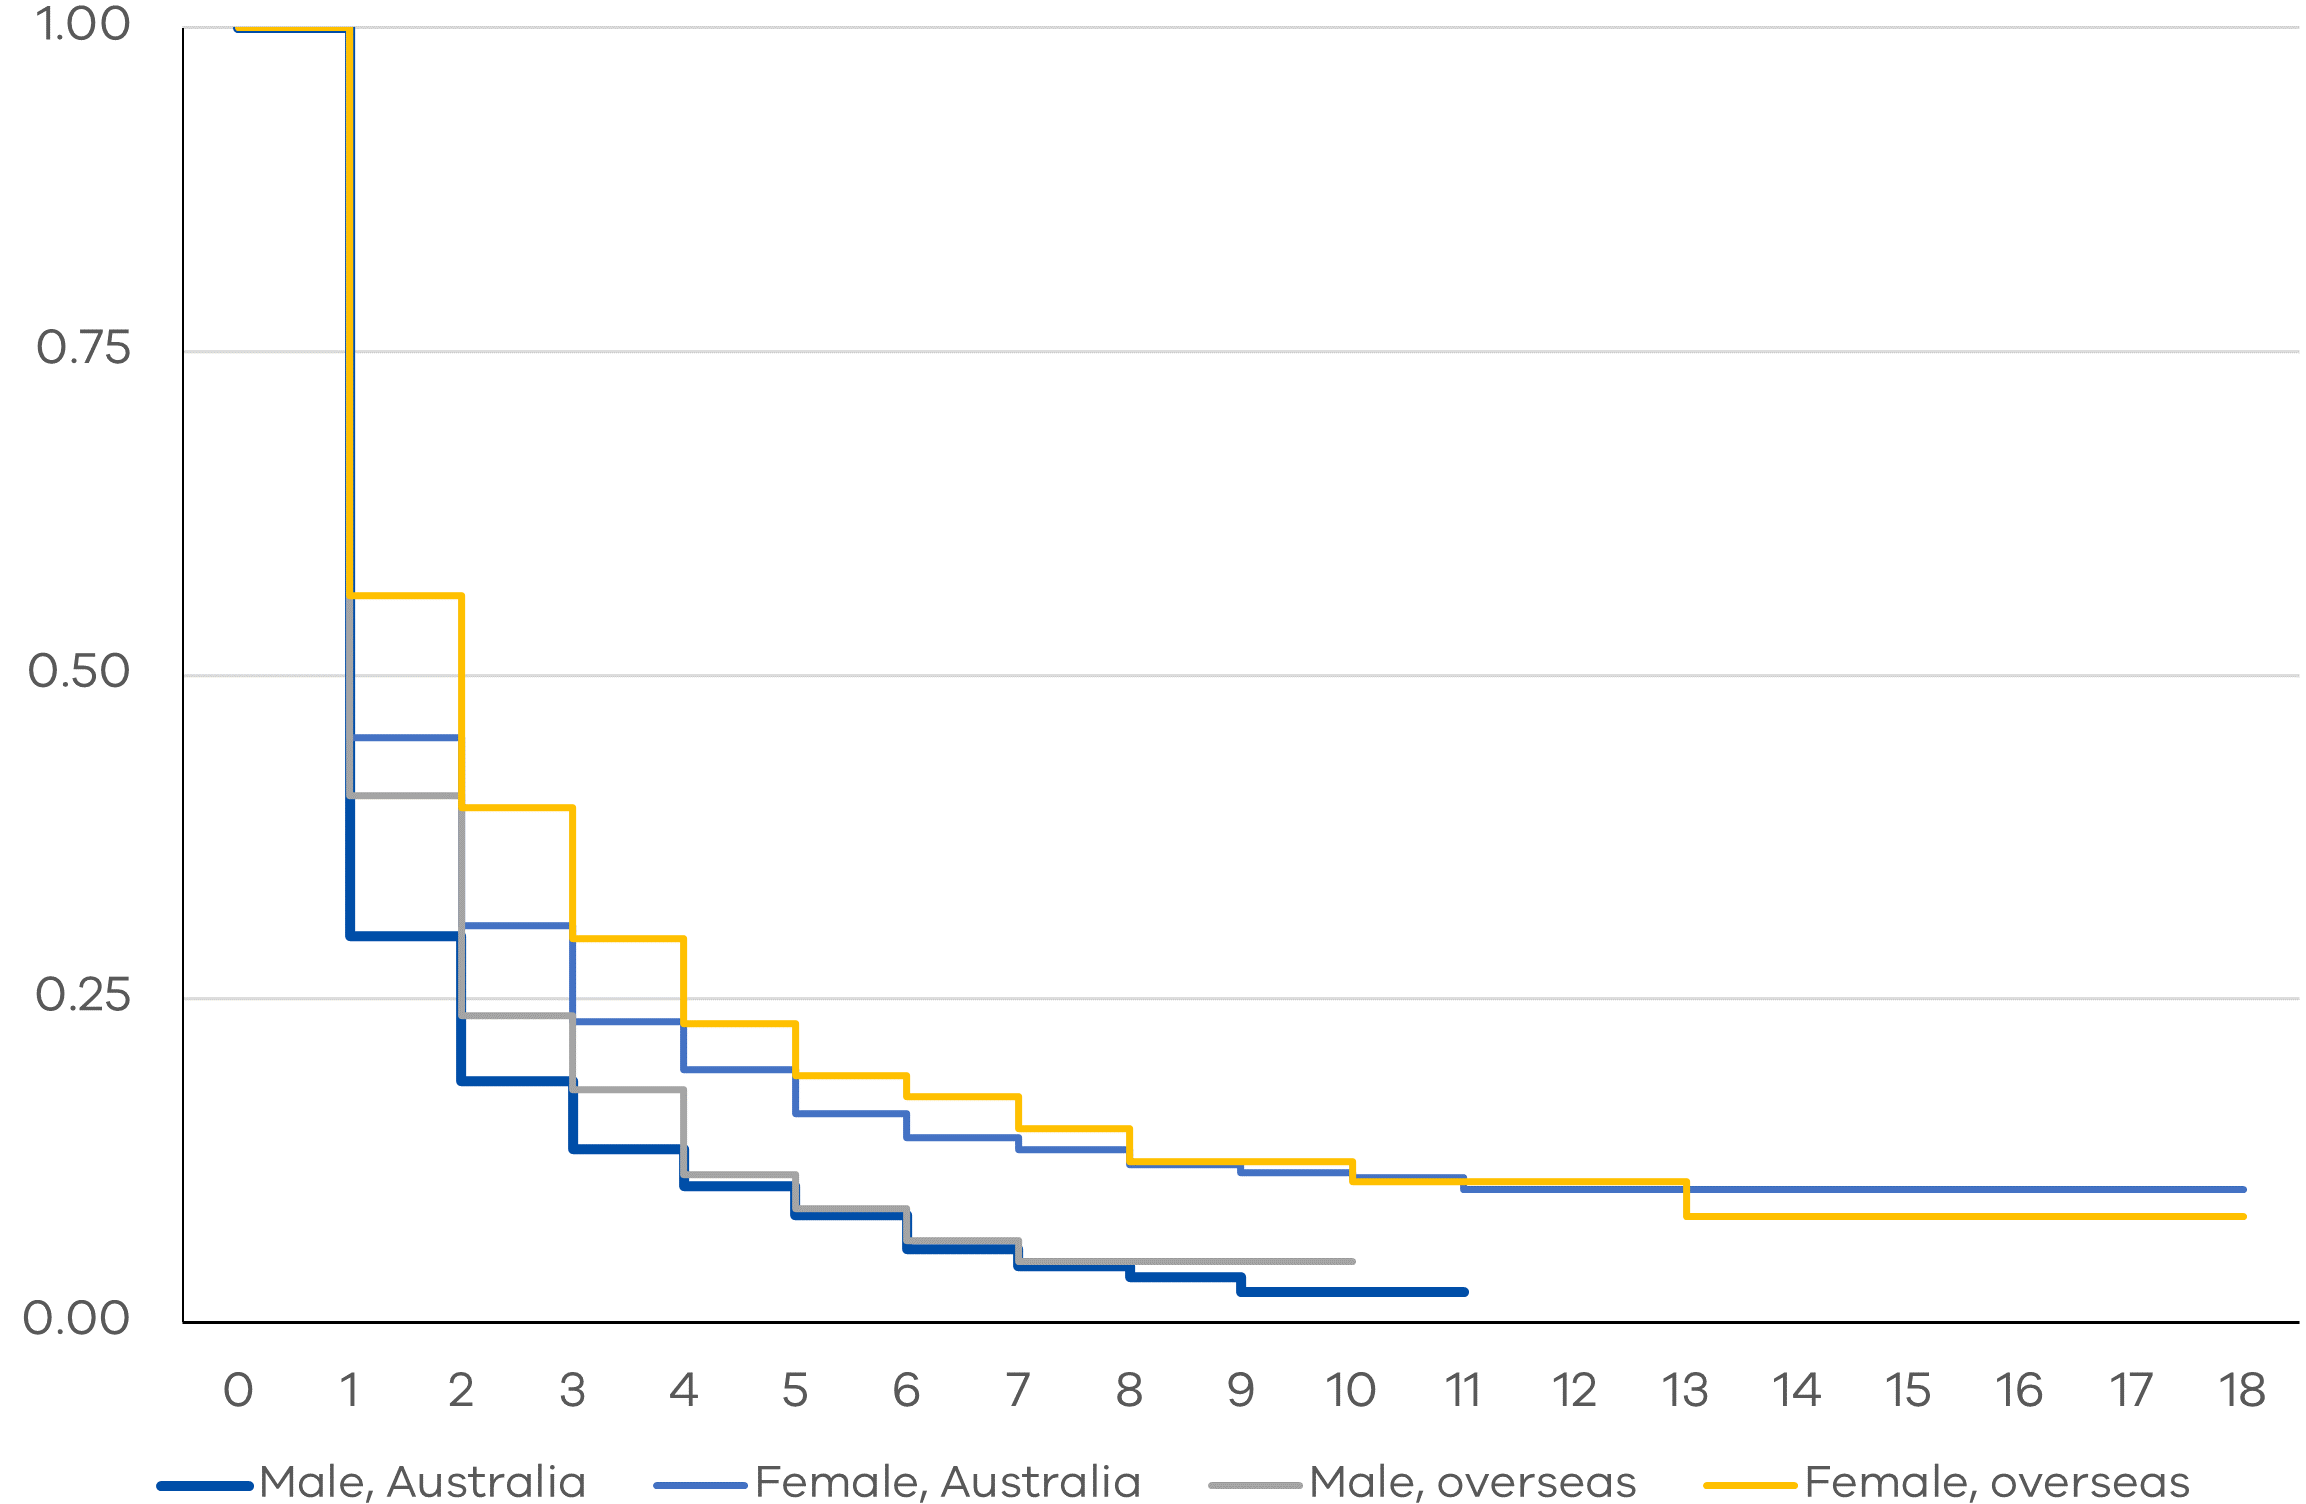
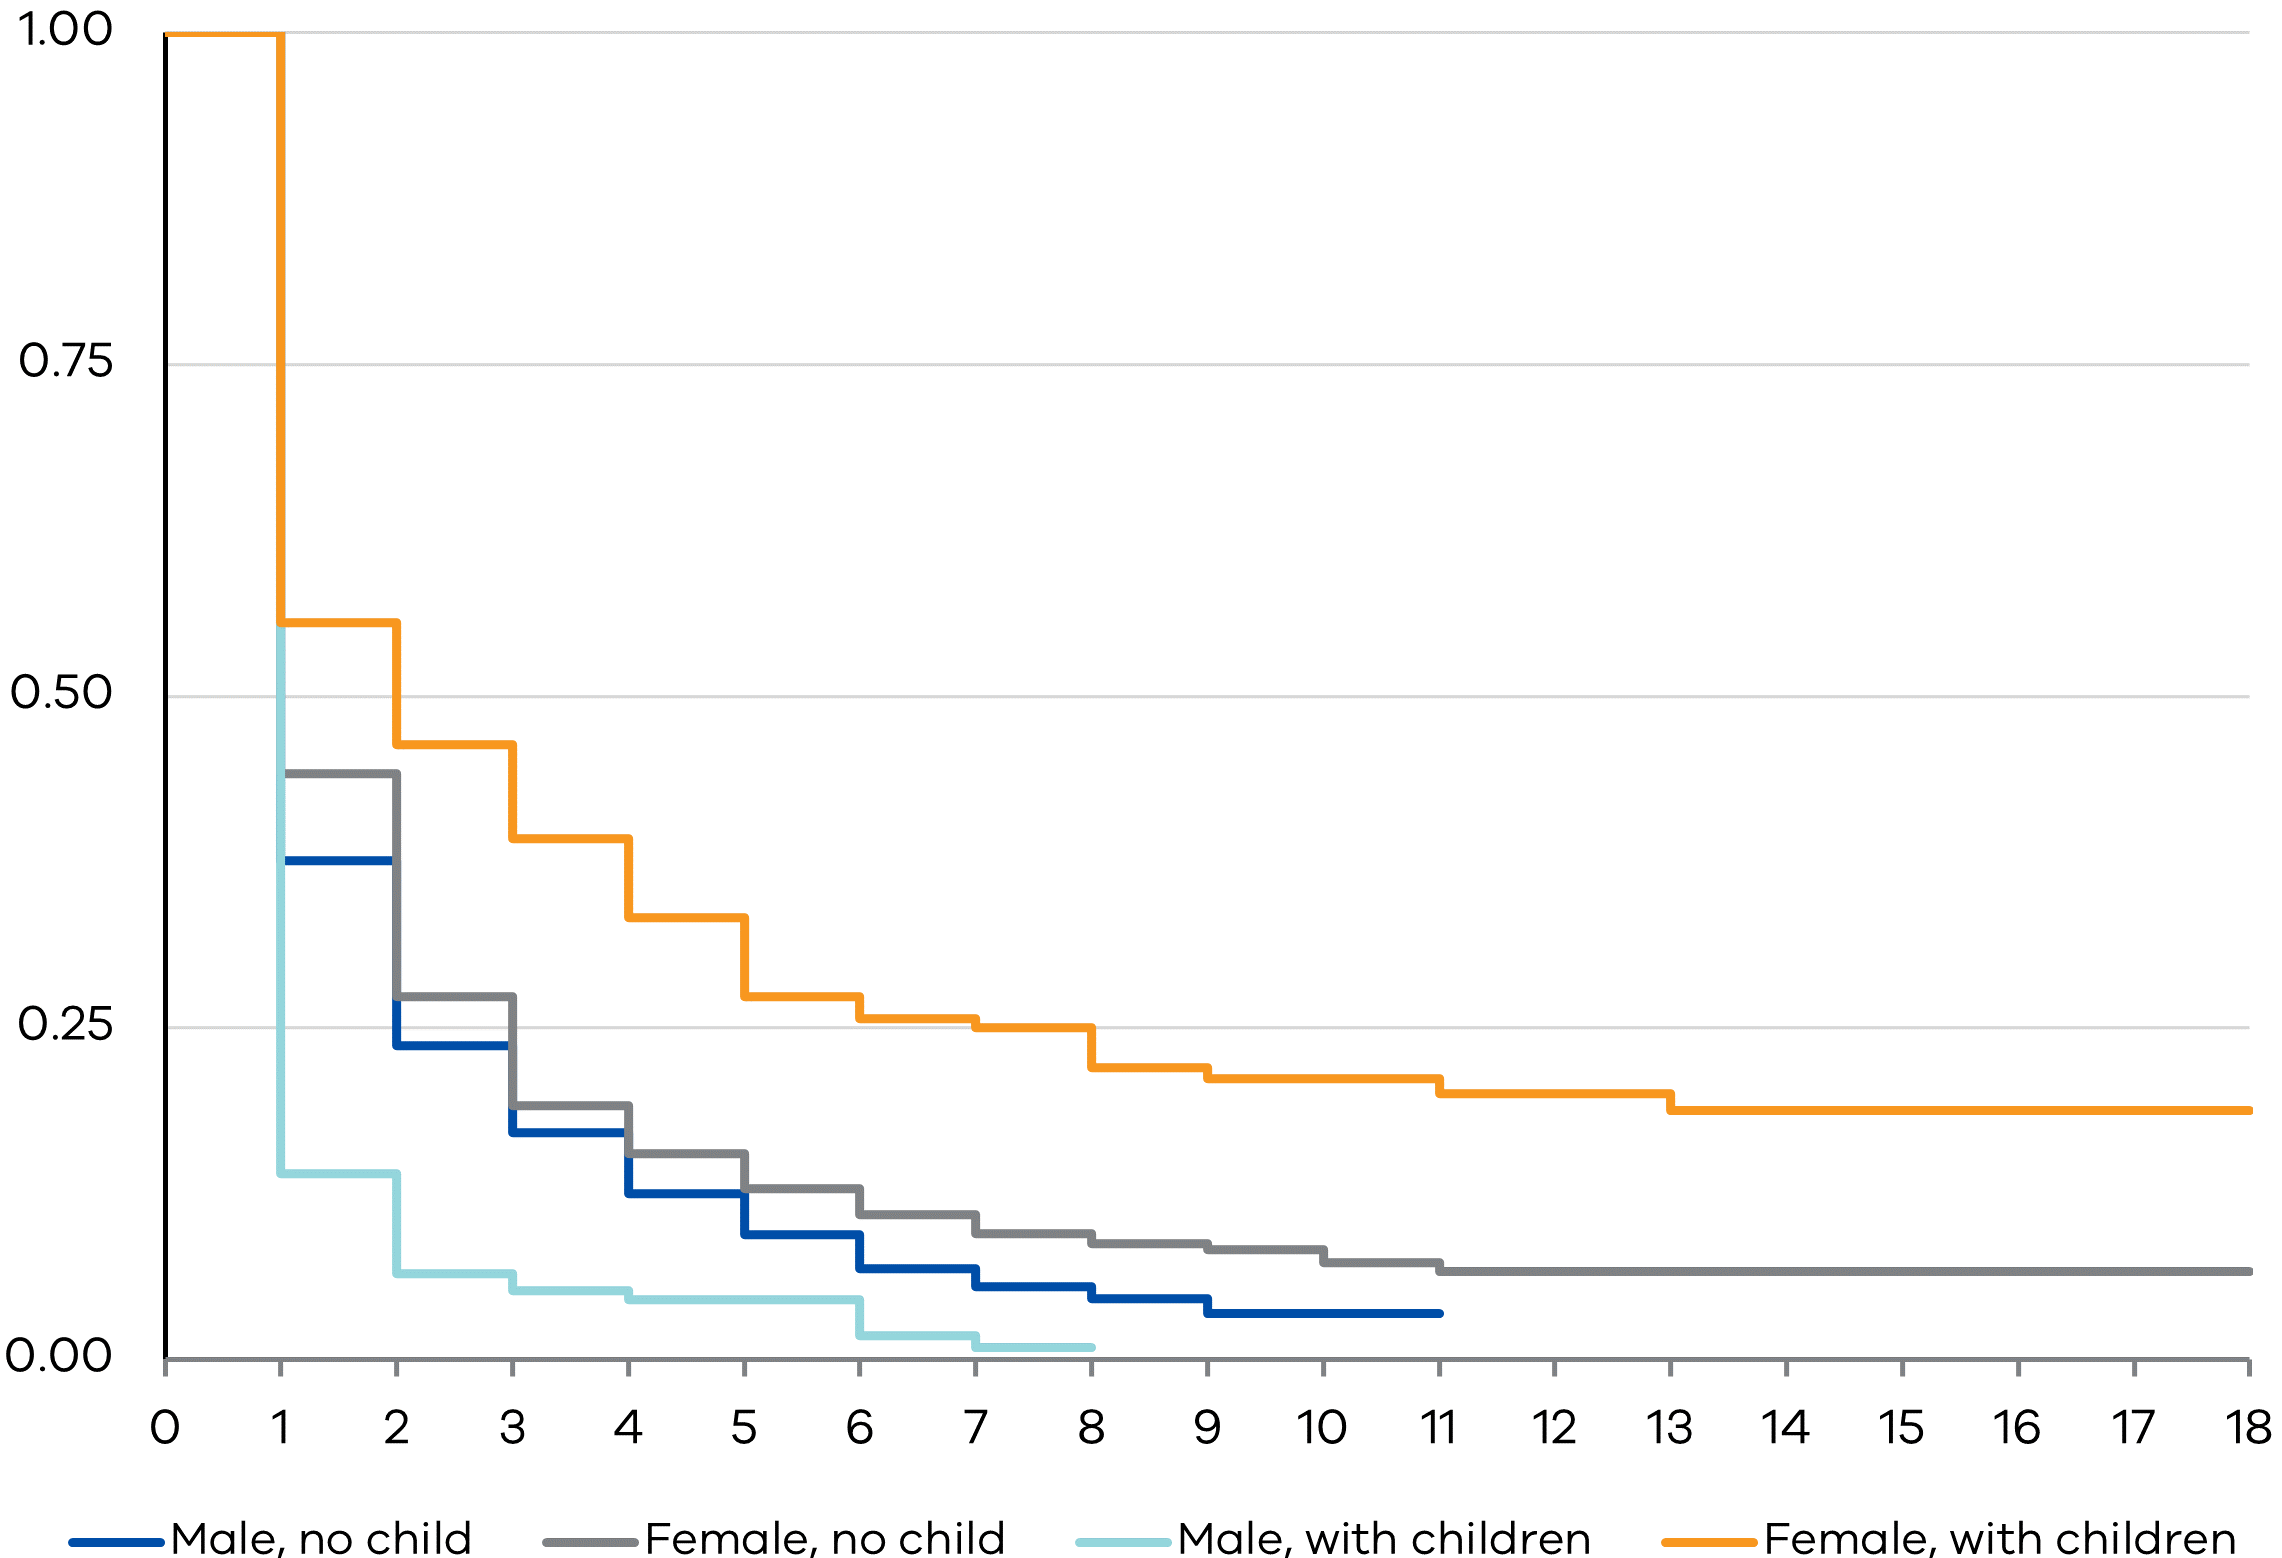
Figure 4d: K-M survival probabilities by gender and parental status
With regard to location or urbanity, we find that women living in cities take longer to find full-time jobs compared to their counterparts living in more regional areas. Given that knowledge roles are known to be concentrated in cities, it is highly probable that greater competition for high-skilled jobs in cities is driving this trend. It may also be possible that because of more limited employment opportunities for tertiary-educated individuals in regional areas, women are more likely to take on lower-skill paid employment in these locations. Among men in our sample, those living in rural areas tend to exit the unemployment queue at a faster rate than men in urban areas. Regardless of location, men experience shorter periods of unemployment than women.
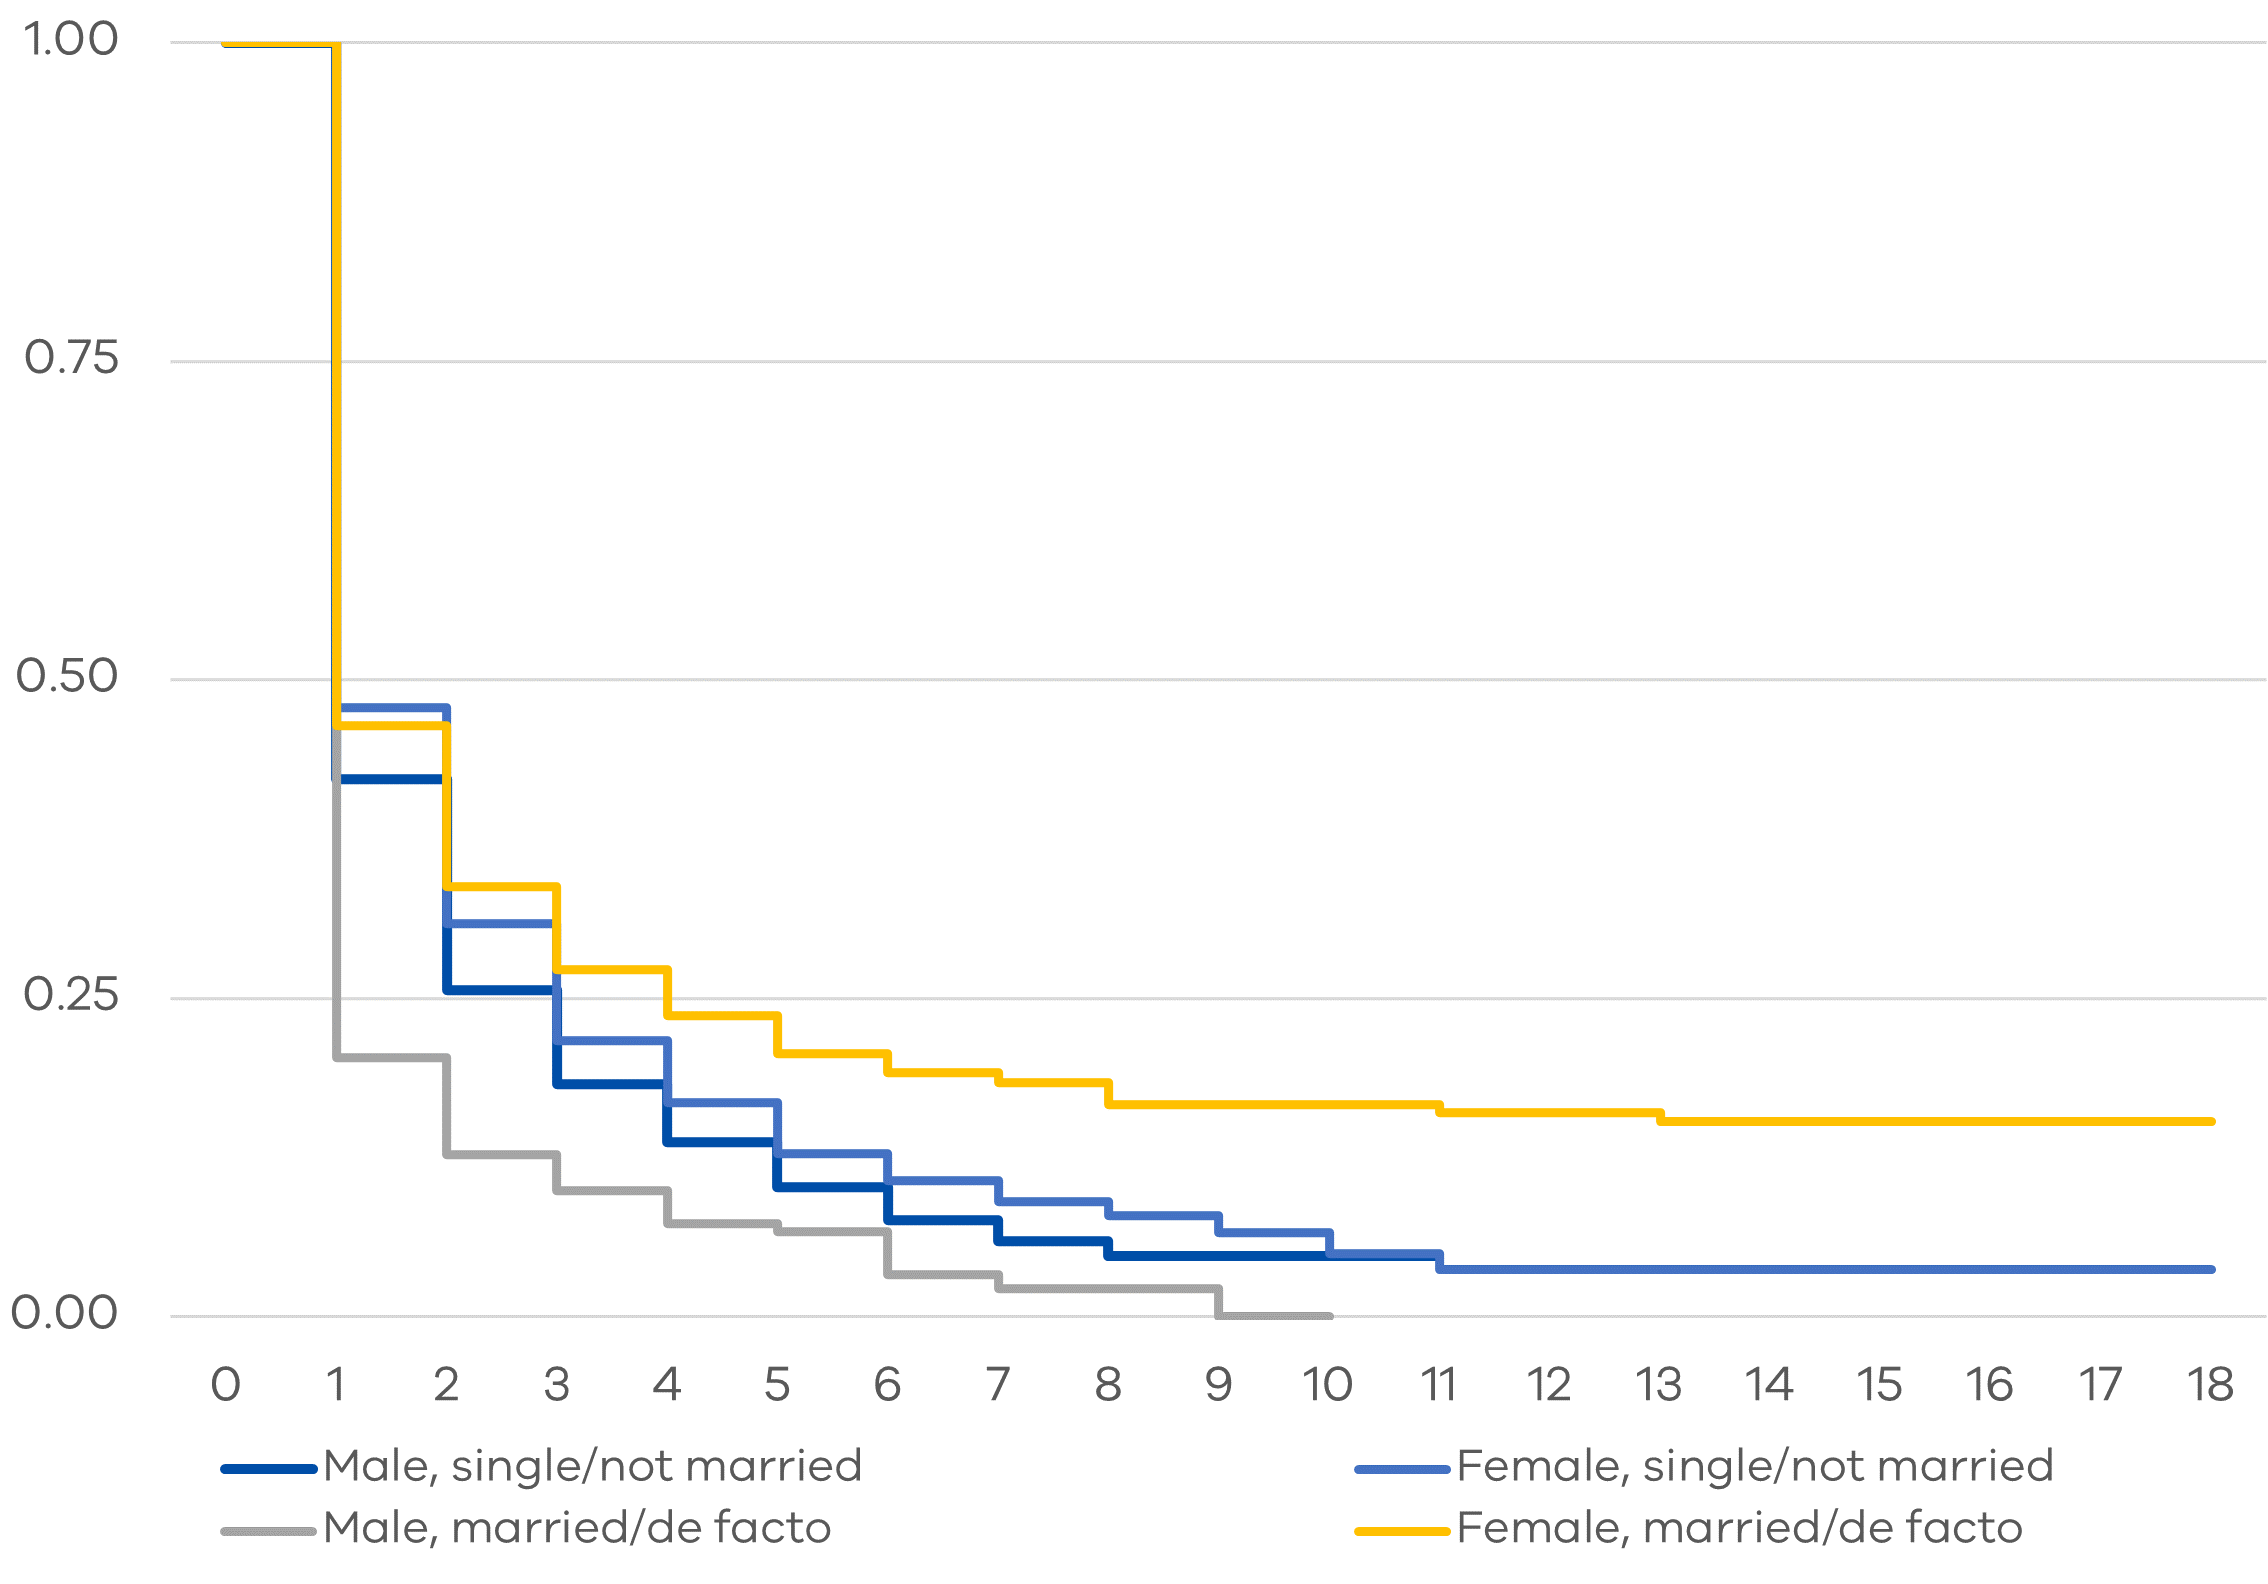
With regards to country of birth, our results show trends that are consistent with the migrant assimilation story. For both men and women, we find that tertiary-educated migrants tend to stay in the unemployment queue longer than their Australian-born counterparts. However, this gap disappears over time as migrants assimilate culturally and professionally. With regards to marital status, we find that married women tend to have the longest unemployment duration spells among those looking for work while married men tend to have the shortest spells. The survival curves for single men and women do not differ significantly. We also find that KM curves for married and single women widen over time.
In Figure 5, the survival probabilities are calculated to obtain the KM survival curves and this time, we partition our sample into the following four groups – (i) men with children (ii) men without children (iii) women with children and (iv) women without children. As previously seen, tertiary-educated women take longer to find full-time jobs than men. Further, among women, the survival rates clearly differ between those with and without children, and that this disparity has only increased over time. The reverse is true of tertiary-educated men – men with children are found to exit the unemployment queue much quicker than men who are not parents. It is also curious to see that the survival curves for childless men and childless women do not exhibit any significant difference. Overall, the survival probability graphs appear largest between those with and without children, other things the same.
Figure 5: K-M survival probabilities by gender and marital status
Footnotes
[1] Recall that in this study, a larger ‘survival’ rate Pr(S) indicates longer times in unemployment, a negative event. Readers may find it easier to interpret this number in terms of its corresponding ‘failure’ rate Pr(F) which is a desirable event, that is, probability of finding a full-time job. Note that Pr(F) = 1 − Pr(S) where 0 < Pr(F) < 1 and 0 < Pr(S) < 1. For any cohort group therefore, we want Pr(S), to be as low as possible and Pr(F) to be as high as possible.
Updated

