4.1 A methodology for estimating GST attributable to household consumption
Step 1: Aggregate GST by household consumption category
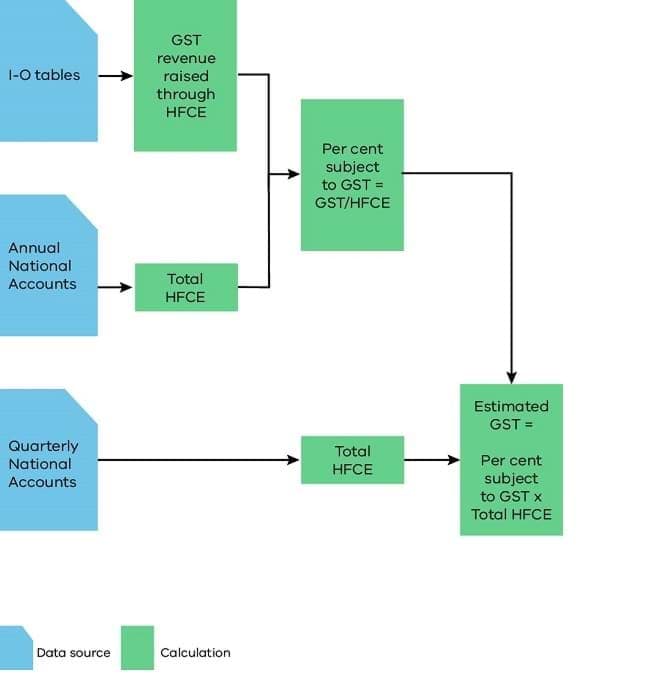
The first step in the methodology (see flow chart in Figure 1) involves aggregating GST expenditures by household consumption categories using I-O tables. The consumption data is categorised into 17 unique household consumption categories as defined by the ABS (see Table 1, Appendix B – Categorisation of household consumption categories). The aggregation is achieved by mapping each unique Input‑Output Product Classification (IOPC) category to its associated household consumption category and summing up the total GST derived from final household consumption expenditure. To estimate the consumption value of expenditure (i.e. before GST was charged) the resulting amounts are divided by 10 per cent1.
Step 2: Calculate ‘percentage GST‑able’ estimators
The consumption value of total subject to GST expenditure by household consumption category, derived in the previous step, is then divided by the total expenditure2 of the corresponding category in the same time period. This calculation can be repeated across multiple time periods3.
Where:
i represents the household final consumption expenditure (HFCE) category.
t represents the time period.
Step 3: Determine a representative ‘percentage GST‑able’ estimator
It is the responsibility of the analyst to review the estimated ‘percentage GST‑able’ estimators by category across the estimated time periods to determine an appropriate estimator for deriving the GST on household consumption time series.
Selecting a representative percentage GST‑able estimator could involve using a simple average if the estimator for a category is broadly similar across years, or a weighted average might be more appropriate to place more emphasis on specific years. Other methods or judgment can be applied to determine a representative estimator for each household consumption category.
Step 4: Derive the GST on household consumption time series
To derive the GST on household consumption series by category, the selected ‘percentage GST‑able’ indicators, determined in the previous step, are multiplied with quarterly household consumption data.4 The GST-free household consumption series can be estimated by subtracting the derived subject to GST series from total household consumption by category.
Figure 1 – Methodology flow chart for estimating GST revenue raised through household consumption
Note: HFCE refers to household final consumption expenditure.
4.2 What are the key concepts of household consumption subject to GST?
GST-able household consumption, by consumption type
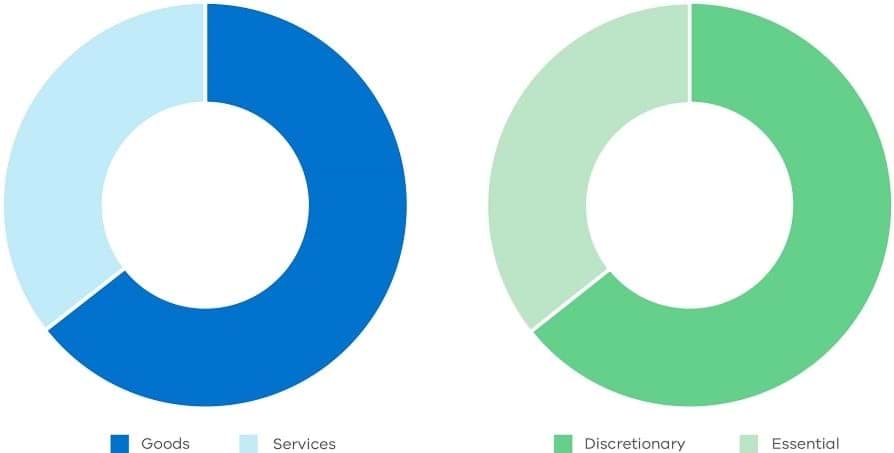
The composition of household consumption subject to GST ('GST-able') is an important consideration for understanding how different types of household consumption influence changes in GST revenue. Goods consumption and discretionary5 spending make up a significant share of GST derived from household consumption. See Figure 2.
Figure 2: Annual share of total ‘GST-able’ household consumption by goods vs services consumption
Source: DTF analysis of ABS data.
Percentage ‘GST-able’ and ‘share’ of household consumption, by consumption category
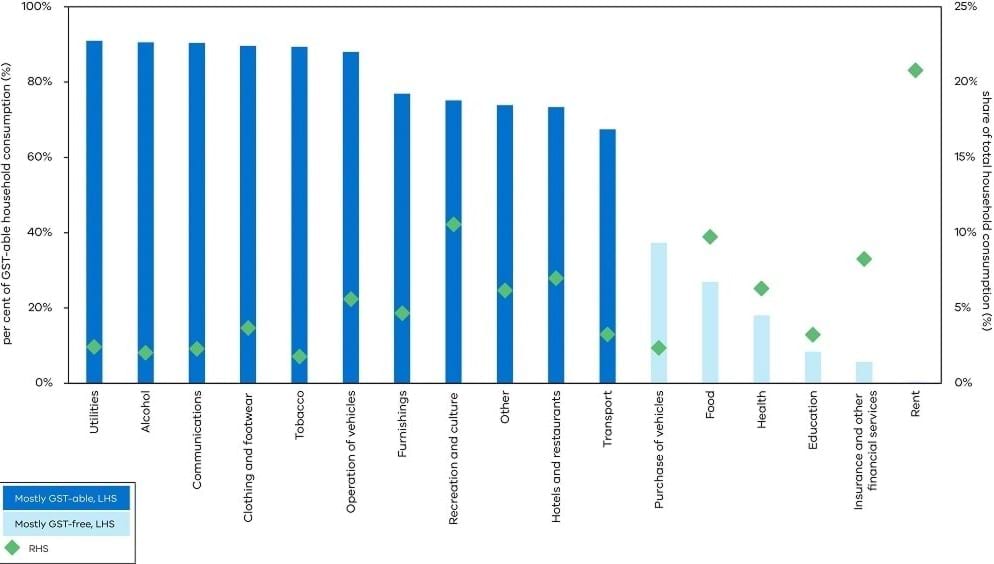
The composition of household consumption subject to GST ('GST-able') is an important consideration for understanding how different types of household consumption influence changes in GST revenue. GST-able estimators reveal that only a small number of household consumption categories are considered mostly GST-free. Goods consumption and discretionary spending make up a significant share of GST derived from household consumption. However, we also find that despite representing a small number of categories, the mostly GST-free items represent a significant share of total consumption by Australian households.
The six categories considered mostly GST-free represent around 50 per cent of the share of total household consumption,6 headlined by rent which accounts for around a fifth of total household consumption. This reveals that the size of the consumption category (or relative share of total household consumption) is an important consideration when analysing the impact of growth between consumption categories (see Figure 3).
Figure 3: Percentage ‘GST-able’ and ‘share’ of total household consumption, by household consumption category
Source: DTF analysis of ABS data.
Footnotes
[1] The current rate of GST is 10 per cent.
[2] ABS Cat No. 5204.0.
[3] Analysis in this report uses data from I-O tables over the period of 2015-16 to 2020-21.
[4] ABS Cat No. 5206.0.
[5] Refer to the list of household consumption categories, categorised by goods versus services and discretionary versus essential, in Appendix B.
[6] This figure represents the total consumption of each category. For example, it is assumed that 100 per cent of food consumption is GST-able, when in fact it is estimated that about a quarter of food consumption is GST-able.
Updated


